
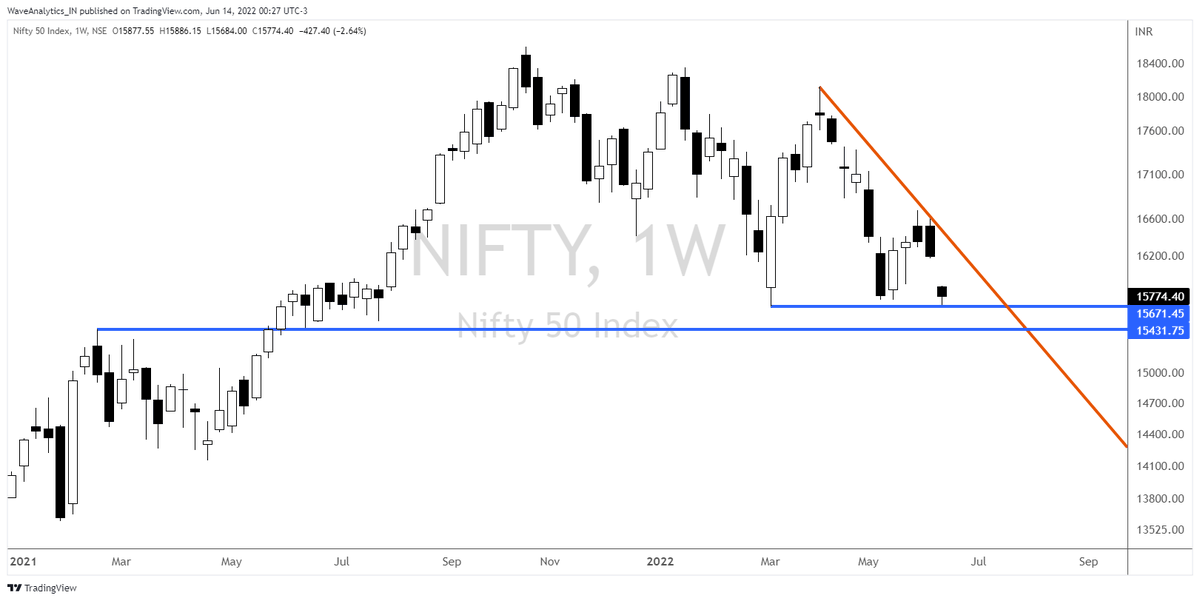
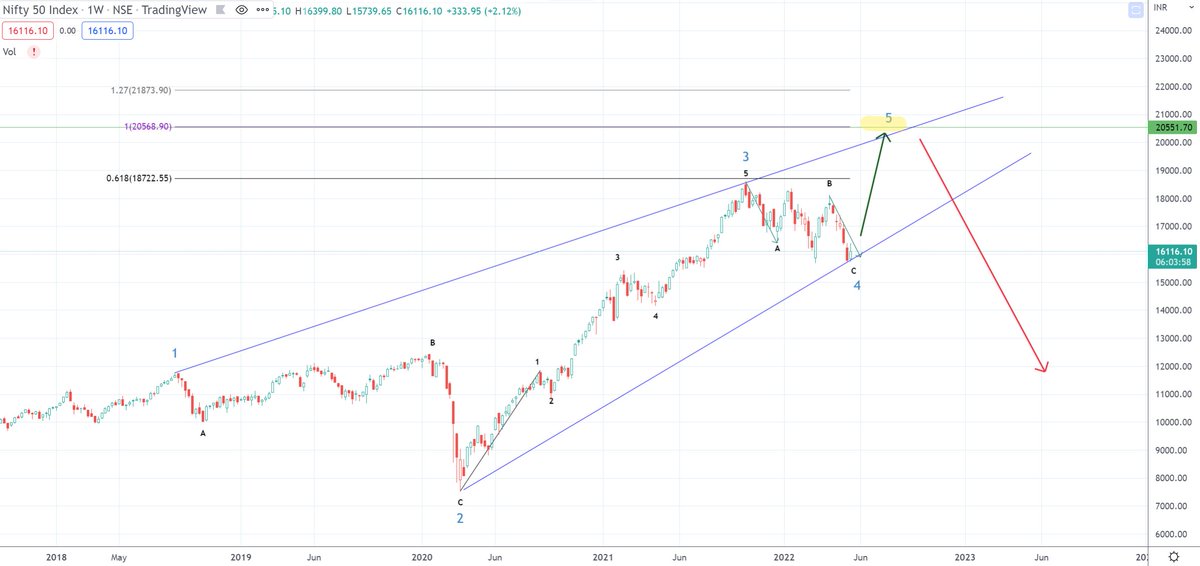
If you truly love her, let her go .. to 15000 and below.
If she loves you, she will come back at 16000 .. later this year or next.
More from Piyush Chaudhry


New All Time High.
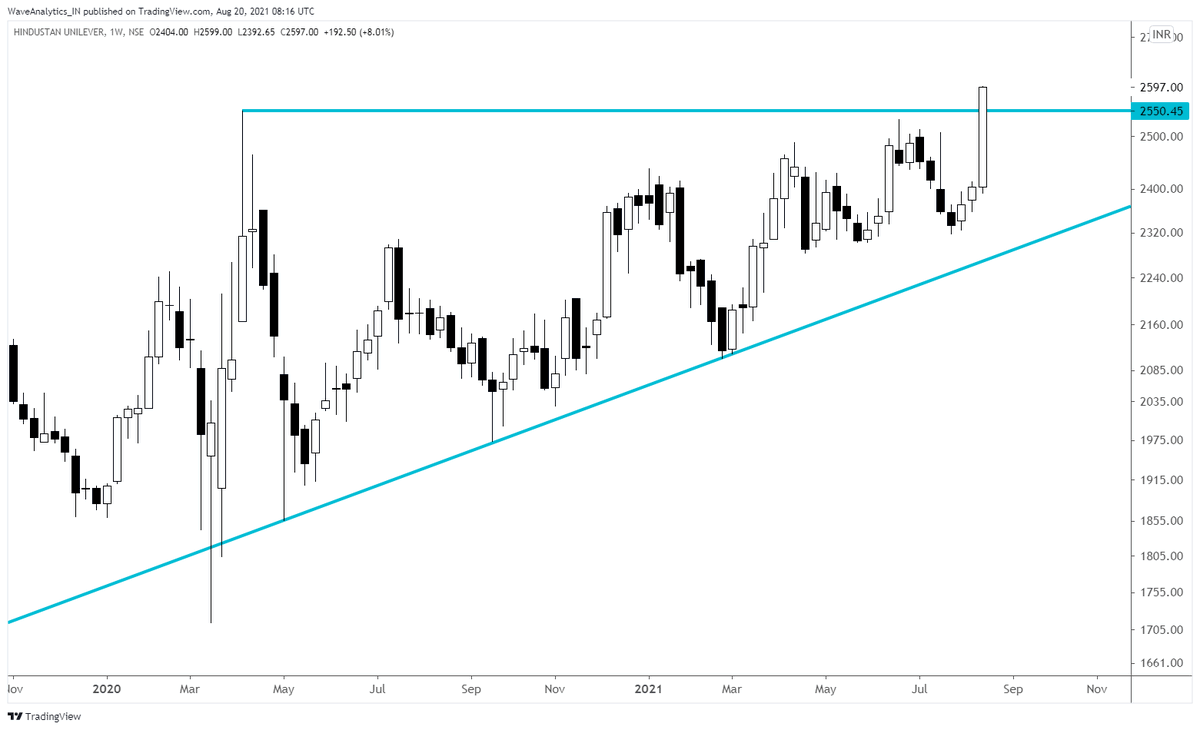
#HINDUNILVR
EW
Long Term Chart of the Month. #HINDUNILVR
— Piyush Chaudhry (@piyushchaudhry) December 9, 2020
Sometime in the next decade I see a fair possibility of stock reaching 7000 odd.
Invalidation below Blue Trendline. #ElliottWave pic.twitter.com/uxQrzt1mbj
as per relative strength
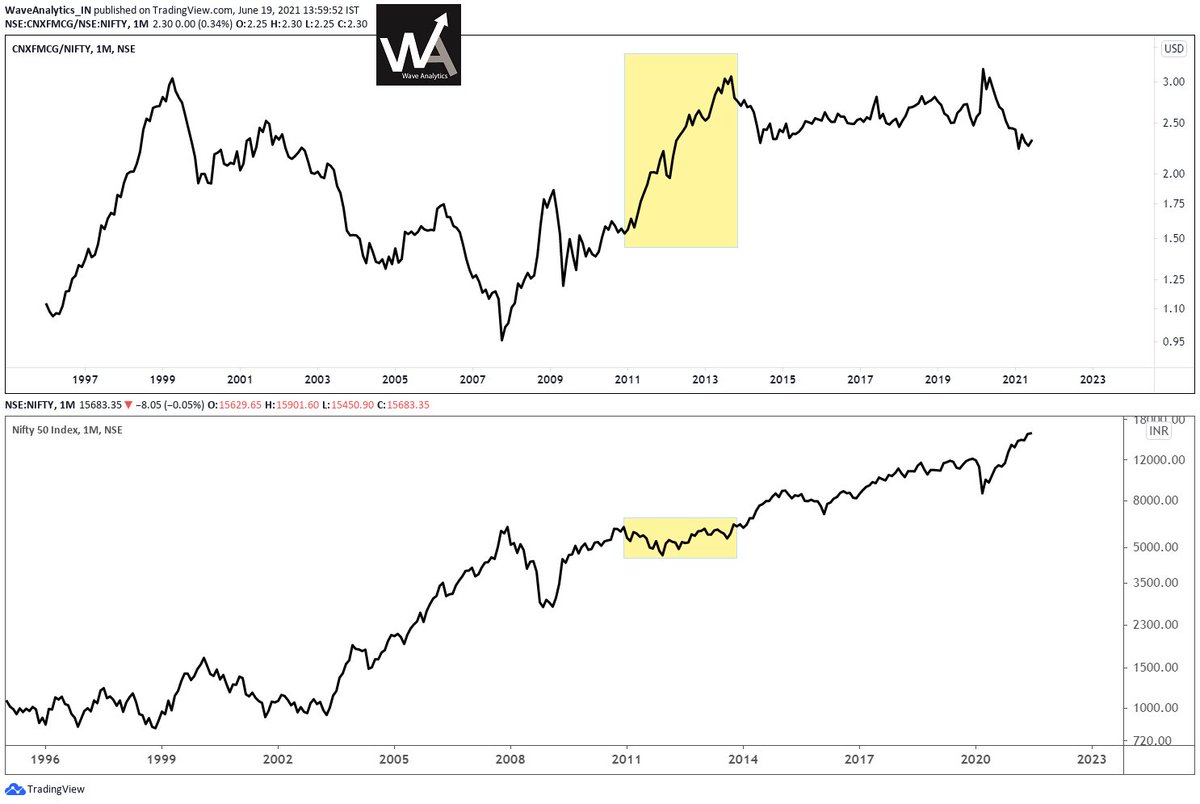
One question that I often get is which of the two: #HINDUNILVR or #ITC would be a better Investment bet. While their individual charts are clear themselves, another approach is ratio chart. IMHO Lever should outperform ITC for several years going forward.https://t.co/3AFqm6FJ1Q pic.twitter.com/rLuIm8xyVw
— Piyush Chaudhry (@piyushchaudhry) December 30, 2020
More from Niftylongterm


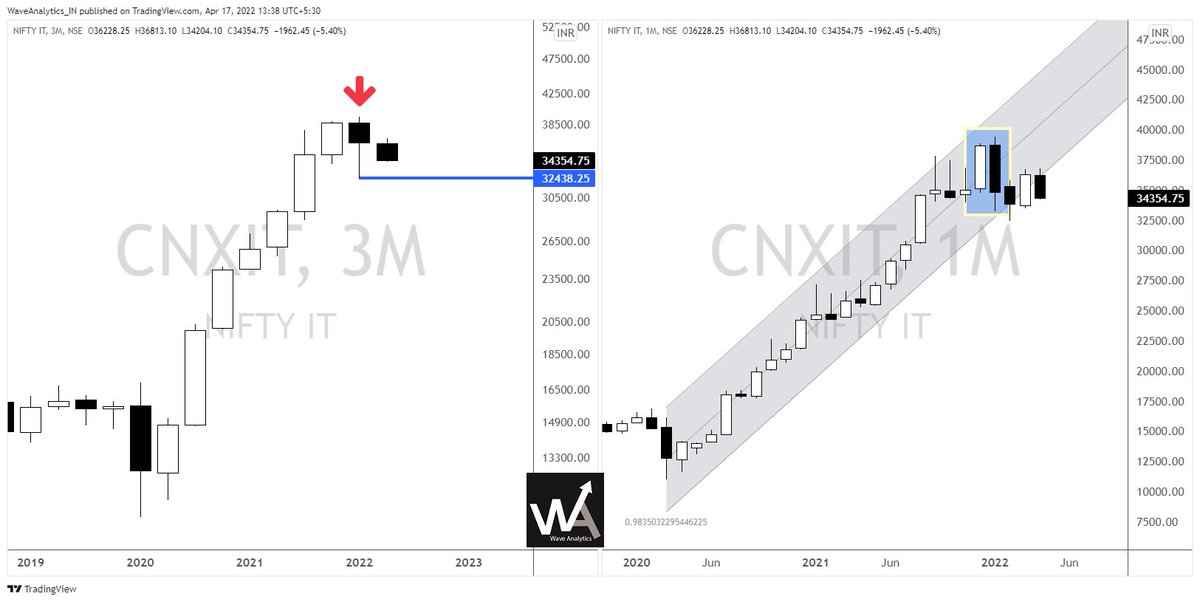
#NIFTY in Regression Channel.
— Piyush Chaudhry (@piyushchaudhry) April 30, 2022
A rectangular consolidation around the central Line of Best Fit, with no such reversal characteristics on display yet.
For it to revisit the upper band, odds would increase only on a break above ~17450.
Else, it's a slippery slope. pic.twitter.com/4OT7JM1TJY
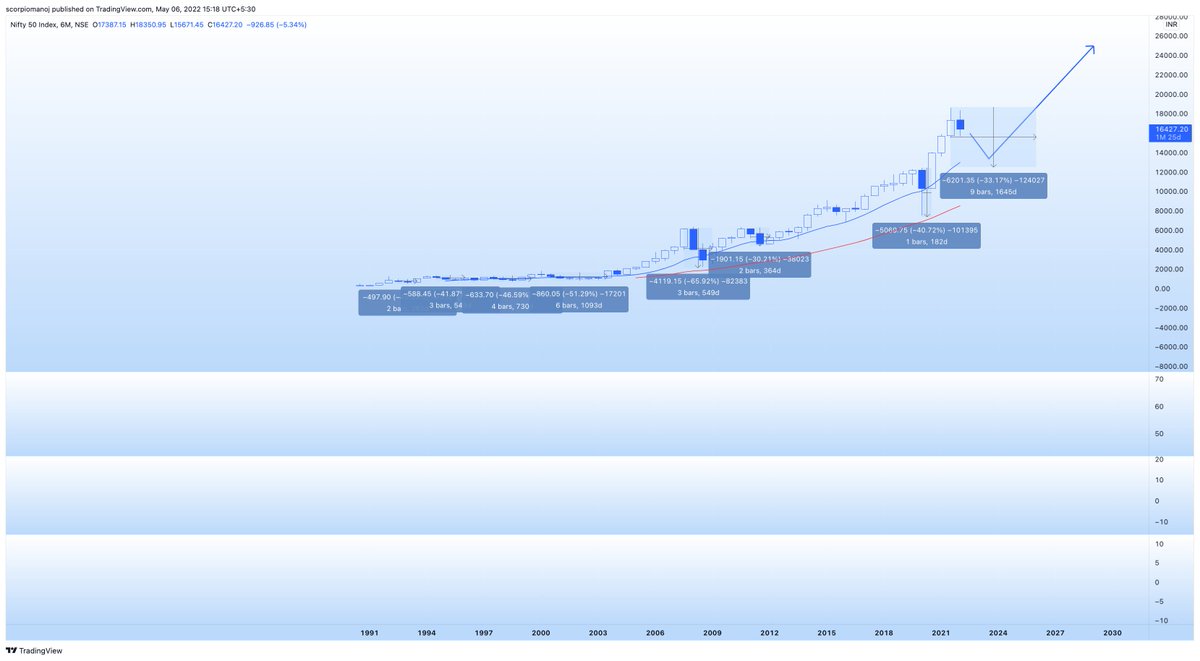
15 Months to this post. No change in the larger projections.
Long Term Chart of the Year.#NIFTY - Wave 5 (Cycle Degree) Target Zone of 25000-34000 by 2024-2027.
— Piyush Chaudhry (@piyushchaudhry) December 19, 2020
Reassessment on a breach below Blue Trendline. A breach is not a necessary invalidation. Depends on internals.
The dashed path is for representative purpose only. #ElliottWave pic.twitter.com/1xVY4OSr5T


You May Also Like











This New York Times feature shows China with a Gini Index of less than 30, which would make it more equal than Canada, France, or the Netherlands. https://t.co/g3Sv6DZTDE
That's weird. Income inequality in China is legendary.
Let's check this number.
2/The New York Times cites the World Bank's recent report, "Fair Progress? Economic Mobility across Generations Around the World".
The report is available here:
3/The World Bank report has a graph in which it appears to show the same value for China's Gini - under 0.3.
The graph cites the World Development Indicators as its source for the income inequality data.

4/The World Development Indicators are available at the World Bank's website.
Here's the Gini index: https://t.co/MvylQzpX6A
It looks as if the latest estimate for China's Gini is 42.2.
That estimate is from 2012.
5/A Gini of 42.2 would put China in the same neighborhood as the U.S., whose Gini was estimated at 41 in 2013.
I can't find the <30 number anywhere. The only other estimate in the tables for China is from 2008, when it was estimated at 42.8.