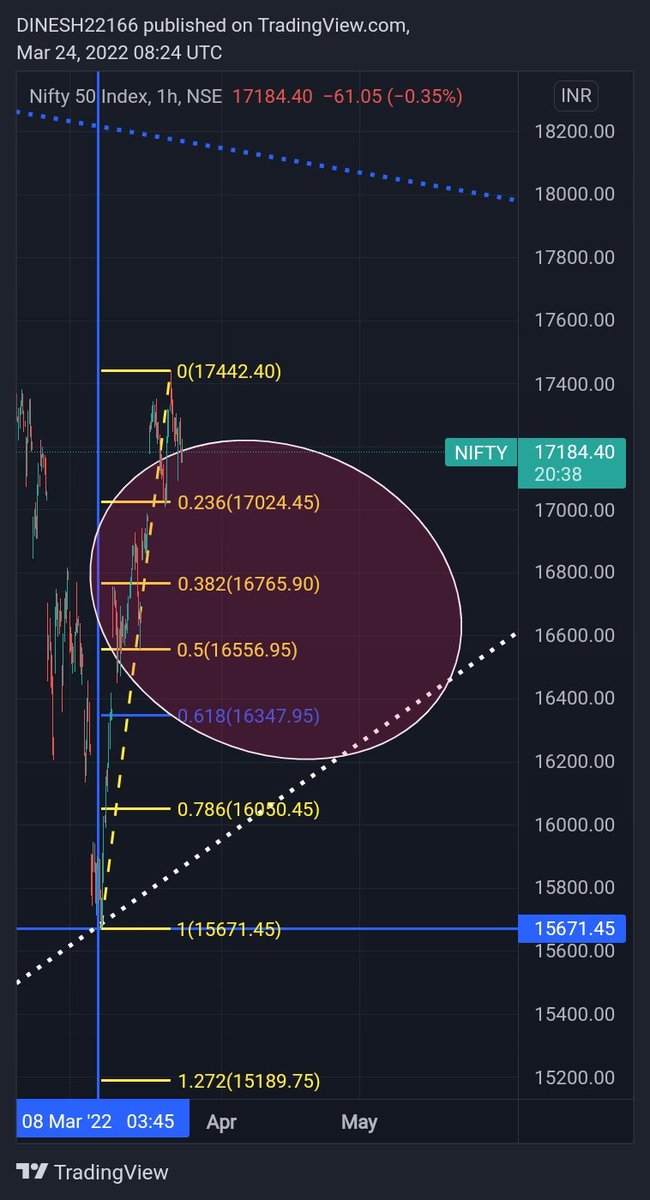
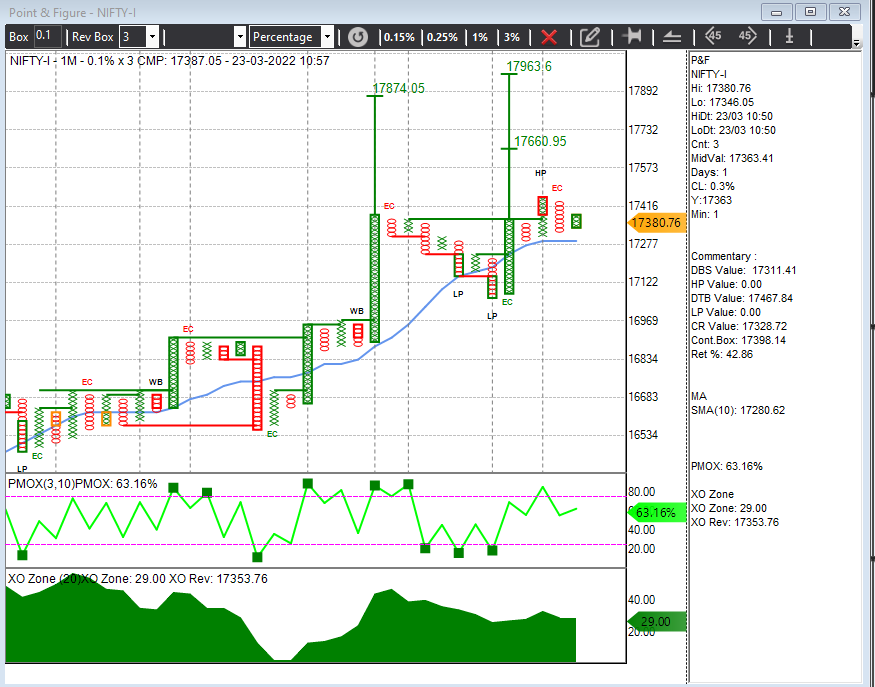
#Nifty 17335
Rising Wedge pattern
Once this wedge breaks down, the retracement levels are marked on the chart. These are the levels where Nifty can take support and bounce higher. Move still playing out. I continue to be bearish short
More from Nishant Kumar
More from Nifty

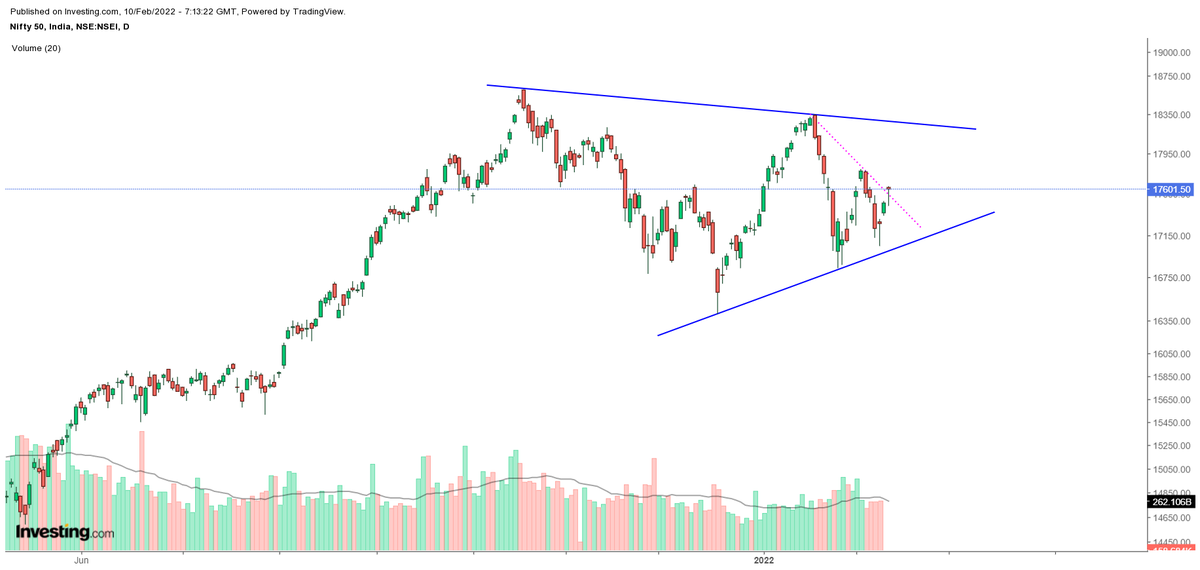
#Nifty -- Going good so far forming triangle as expected.
Till it breakouts expect pendulum swings within this structure.
I am positive for 19300-20000 above 18350.
Bottoms 16800-17000 in place and 200dema at 16600. Dont see any big cut. @moneyworks4u_fa https://t.co/lceGFlDyRM
Till it breakouts expect pendulum swings within this structure.
I am positive for 19300-20000 above 18350.
Bottoms 16800-17000 in place and 200dema at 16600. Dont see any big cut. @moneyworks4u_fa https://t.co/lceGFlDyRM
#Nifty taking a shape of triangle rather than CNH.
— Shivaji Vitthalrao\U0001f1ee\U0001f1f3 (@shivaji_1983) January 29, 2022
Confirmation point is same 18350 and targets also same as below \U0001f447
Traingle /CNH whats in a name as long as targets and Confirmation point is same. https://t.co/vfM1odTd94