
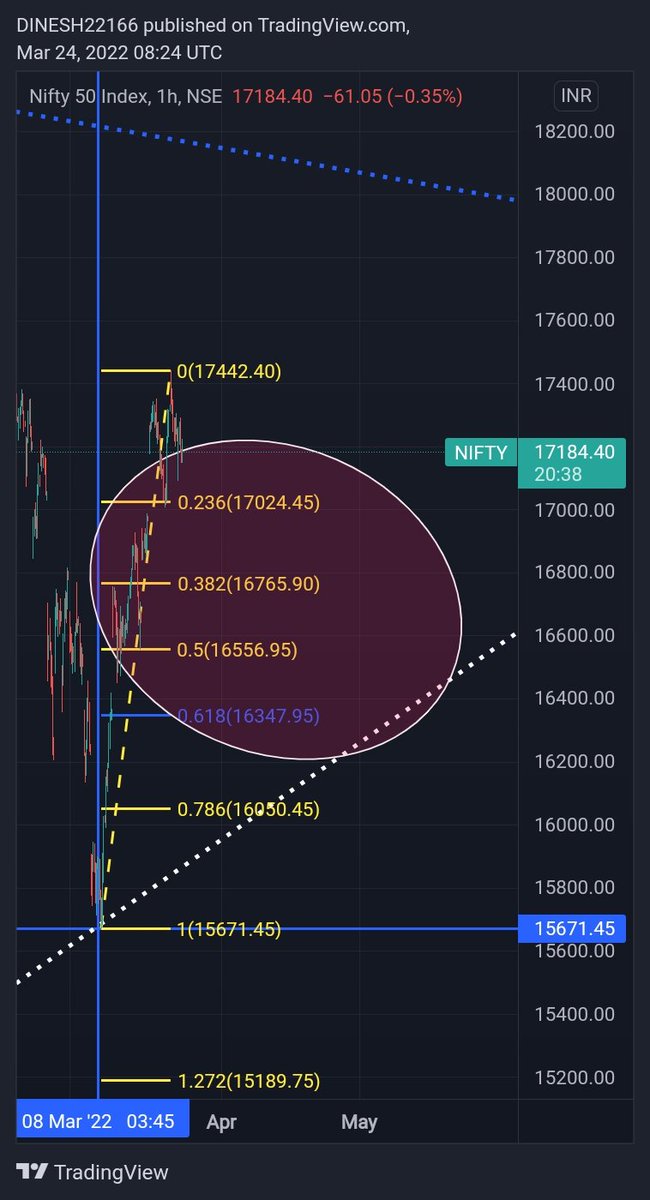
#NiFTY_50(17185)
Circle Mark is minimum goal on 60 minutes chart.
#Perspective
More from Waves_Perception(Dinesh Patel) मैंSchedule Tribe)
More from Nifty



Till it breakouts expect pendulum swings within this structure.
I am positive for 19300-20000 above 18350.
Bottoms 16800-17000 in place and 200dema at 16600. Dont see any big cut. @moneyworks4u_fa https://t.co/lceGFlDyRM
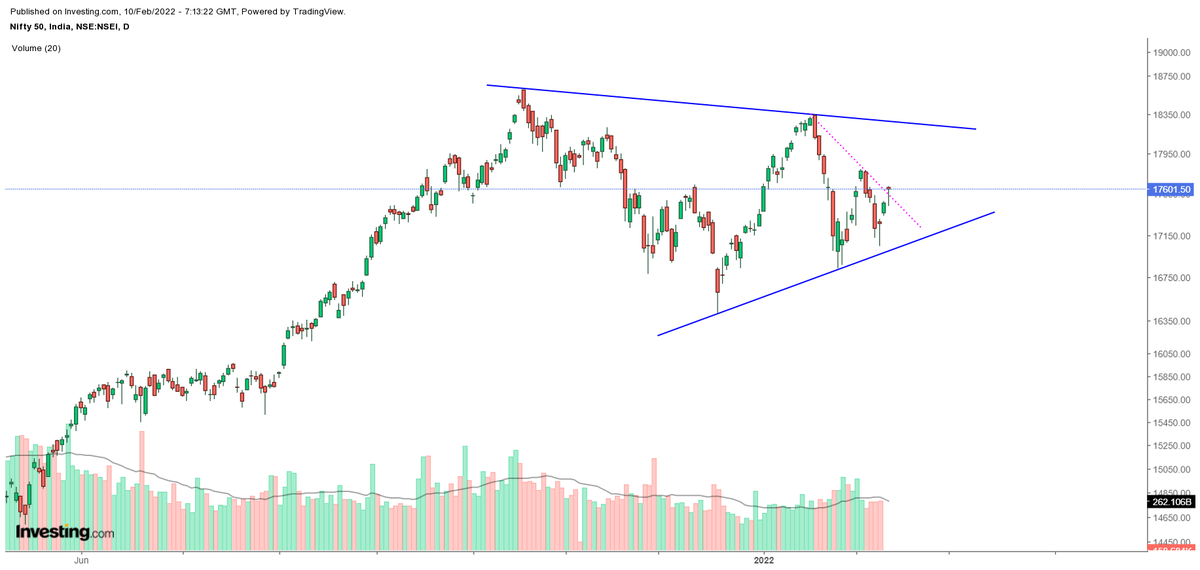
#Nifty taking a shape of triangle rather than CNH.
— Shivaji Vitthalrao\U0001f1ee\U0001f1f3 (@shivaji_1983) January 29, 2022
Confirmation point is same 18350 and targets also same as below \U0001f447
Traingle /CNH whats in a name as long as targets and Confirmation point is same. https://t.co/vfM1odTd94
Low made 17129.55
Objective 0.382% (17181) #done.
If nifty not sustain above today and high and gap remain gap than more downside open till Fibonacci retracement
0.50%(16893) and 0.618%(16604
#Probability
#NiFTY_50(17475)
— Waves_Perception(Dinesh Patel) \u092e\u0948\u0902Schedule Tribe) (@idineshptl) April 17, 2022
Daily chart and monthly chart.
Dail chart show Fibonacci retracement level 1st 0.236% done.
Next objetive is to test 2nd 0.382%17181 during the entire week and close near to it.#MACD#RSI pic.twitter.com/Bt9bJuHDFh

You May Also Like





1 - open trading view in your browser and select stock scanner in left corner down side .
2 - touch the percentage% gain change ( and u can see higest gainer of today)
Making thread \U0001f9f5 on trading view scanner by which you can select intraday and btst stocks .
— Vikrant (@Trading0secrets) October 22, 2021
In just few hours (Without any watchlist)
Some manual efforts u have to put on it.
Soon going to share the process with u whenever it will be ready .
"How's the josh?"guys \U0001f57a\U0001f3b7\U0001f483
3. Then, start with 6% gainer to 20% gainer and look charts of everyone in daily Timeframe . (For fno selection u can choose 1% to 4% )
4. Then manually select the stocks which are going to give all time high BO or 52 high BO or already given.
5. U can also select those stocks which are going to give range breakout or already given range BO
6 . If in 15 min chart📊 any stock sustaing near BO zone or after BO then select it on your watchlist
7 . Now next day if any stock show momentum u can take trade in it with RM
This looks very easy & simple but,
U will amazed to see it's result if you follow proper risk management.
I did 4x my capital by trading in only momentum stocks.
I will keep sharing such learning thread 🧵 for you 🙏💞🙏
Keep learning / keep sharing 🙏
@AdityaTodmal
