That makes NIFTY an outlier, with the philosophical question being for how long can we persist?
NIFTY & US 10 Year Yield have a high degree of positive directional correlation. Anyhow, they are diverging at the moment though the divergence can go on for a long period of time as well, last time around this divergence did not work well for NIFTY & it got pulled down.
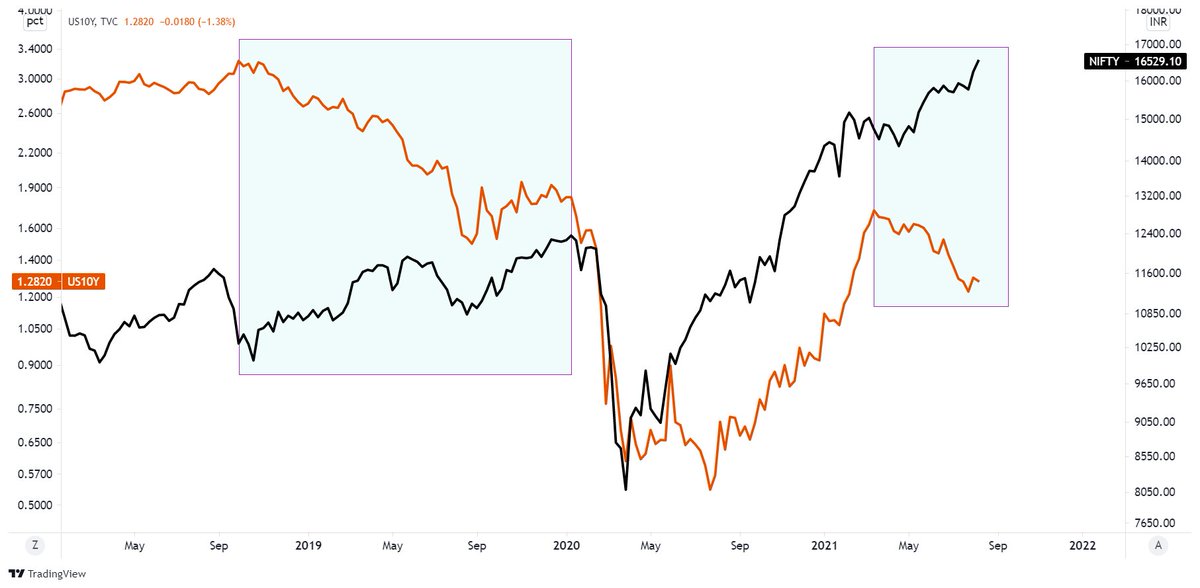
That makes NIFTY an outlier, with the philosophical question being for how long can we persist?
More from Piyush Chaudhry

When everyone got tired, Lever woke up!
New All Time High.
#HINDUNILVR
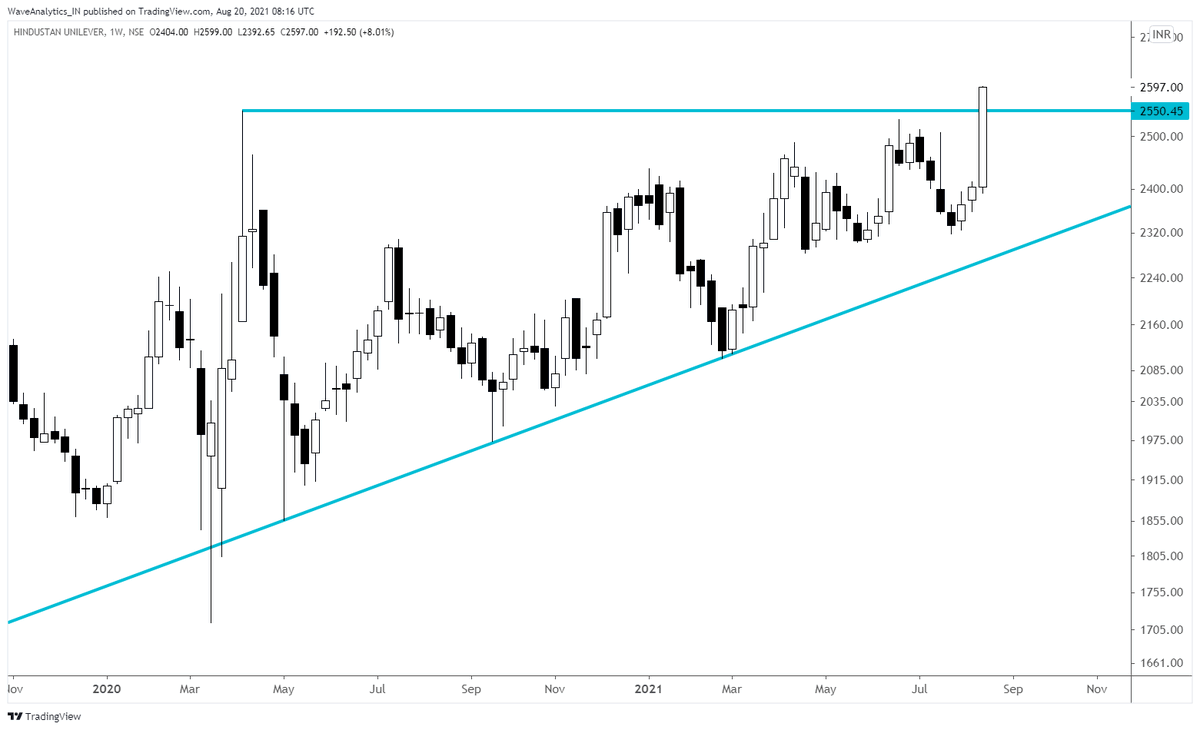
EW
as per relative strength
New All Time High.
#HINDUNILVR
EW
Long Term Chart of the Month. #HINDUNILVR
— Piyush Chaudhry (@piyushchaudhry) December 9, 2020
Sometime in the next decade I see a fair possibility of stock reaching 7000 odd.
Invalidation below Blue Trendline. #ElliottWave pic.twitter.com/uxQrzt1mbj
as per relative strength
One question that I often get is which of the two: #HINDUNILVR or #ITC would be a better Investment bet. While their individual charts are clear themselves, another approach is ratio chart. IMHO Lever should outperform ITC for several years going forward.https://t.co/3AFqm6FJ1Q pic.twitter.com/rLuIm8xyVw
— Piyush Chaudhry (@piyushchaudhry) December 30, 2020

More from Nifty
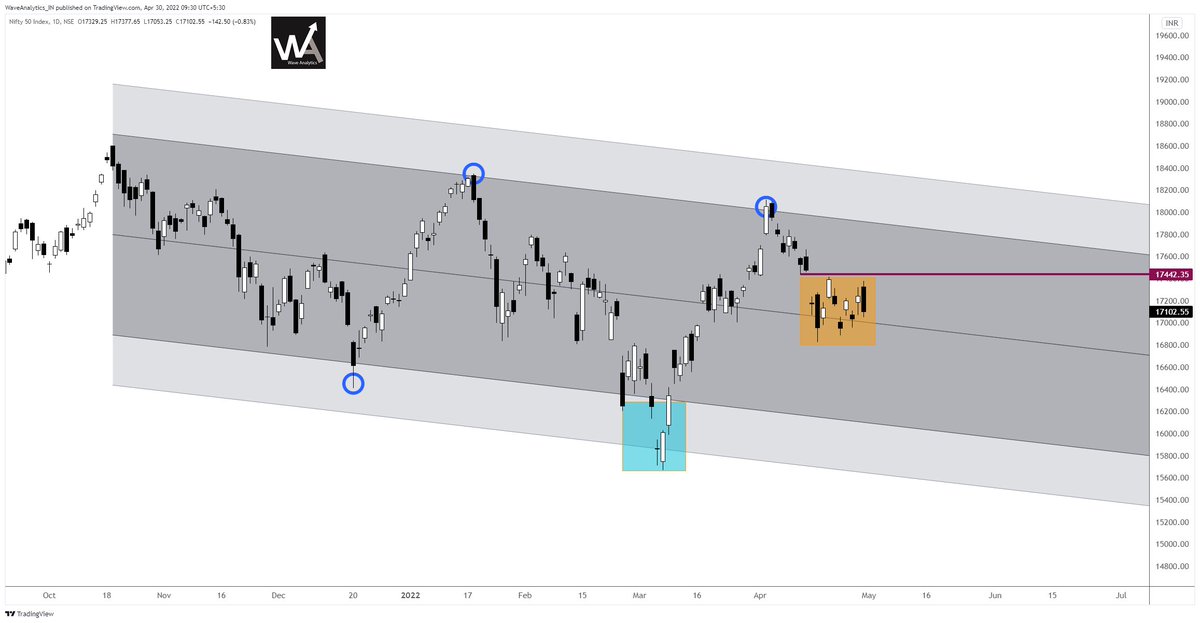


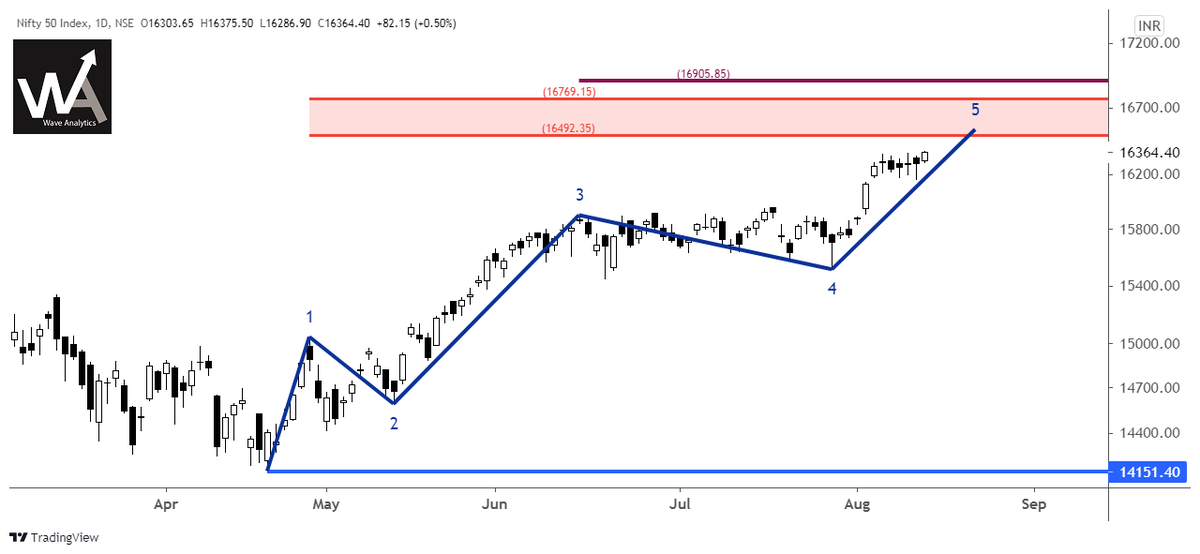
Having the same view as before in Nifty. Is it a prediction? No, it is calculated trajectory based on the historical fractals. Manual version of backtest with a tinge of experience.
#Nifty50 https://t.co/ajpEwosu3v
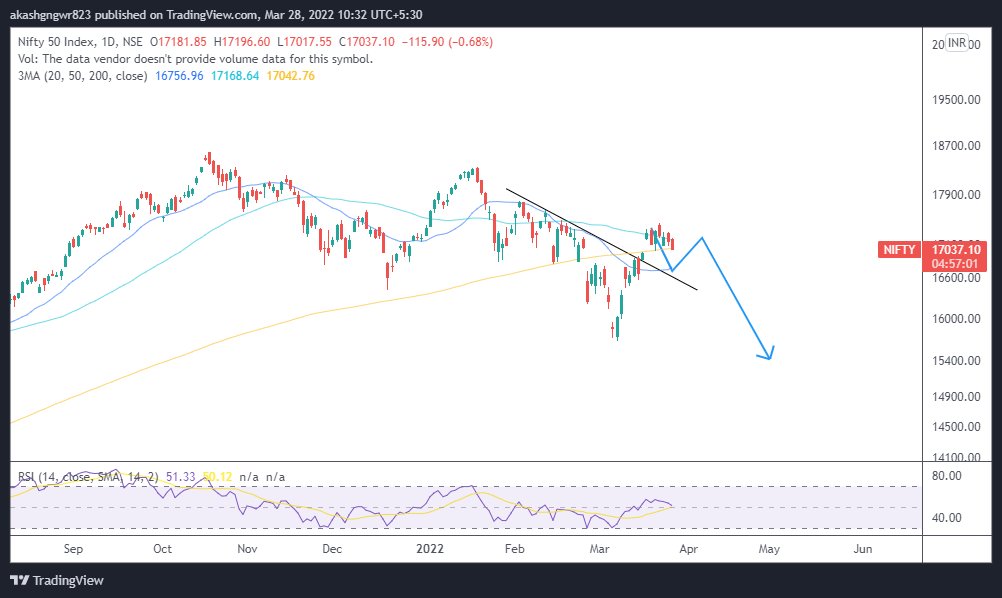
#Nifty50 https://t.co/ajpEwosu3v
JK bhai let's have fake breakout in Nifty \U0001f61c
— Aakash Gangwar (@akashgngwr823) March 10, 2022
Not joking though, have a reason to anticipate that. https://t.co/idzSRIpWga pic.twitter.com/MNsTm3Mron