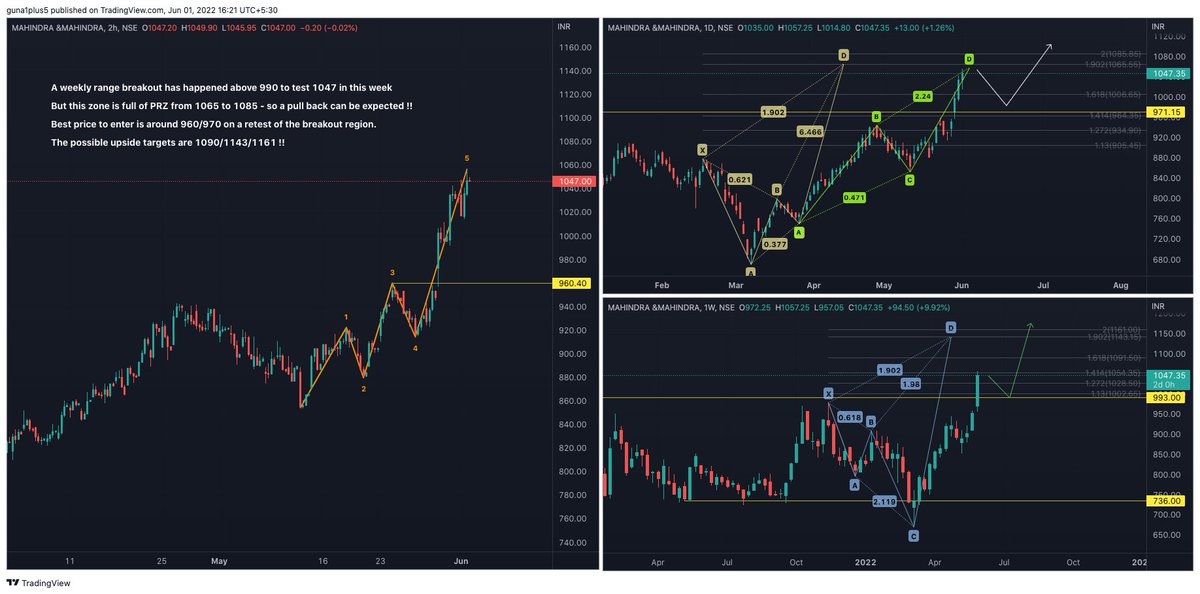
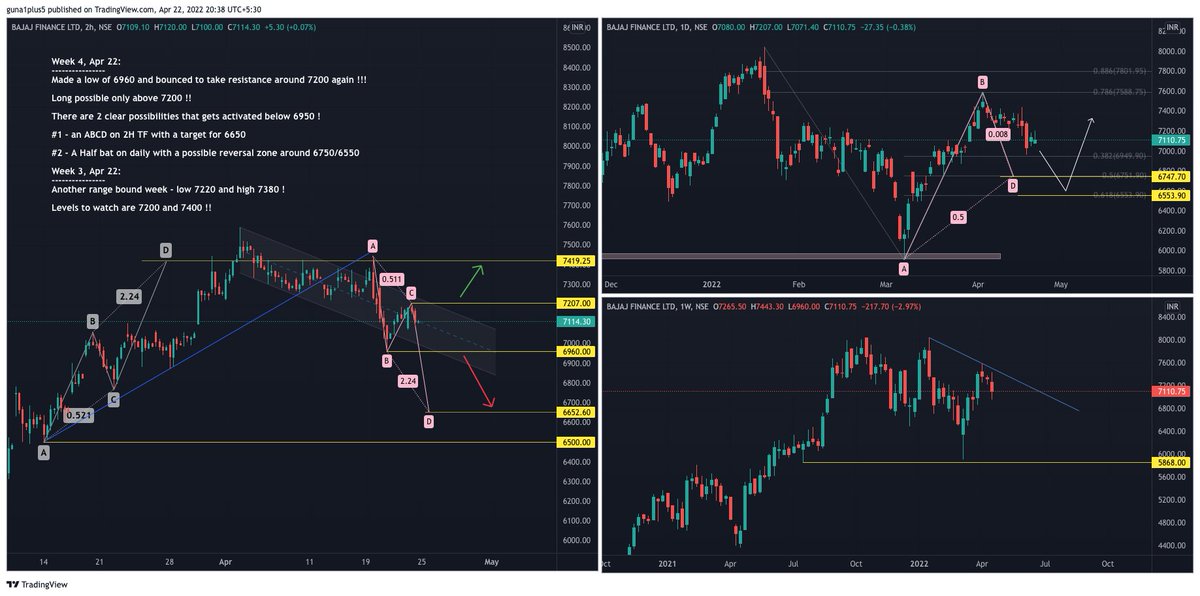
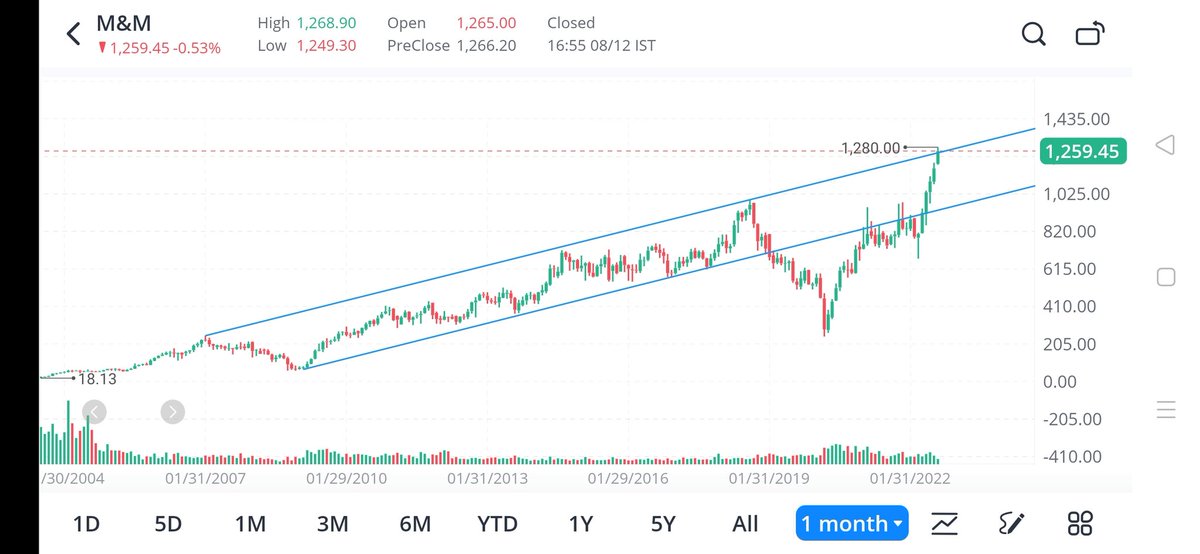
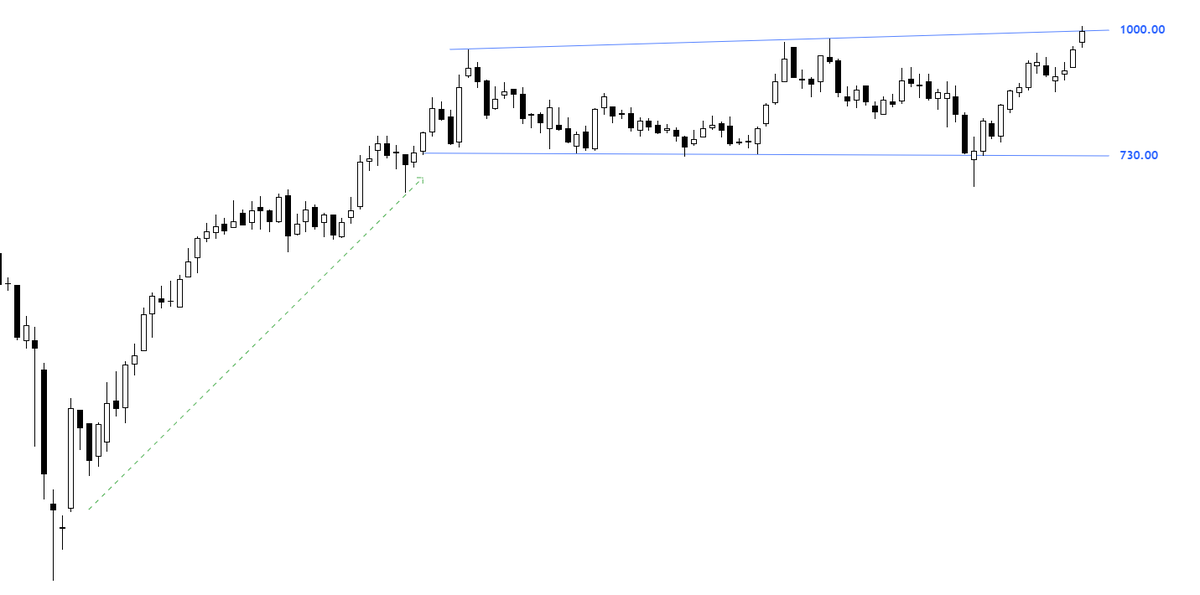
#M_M Weekly breakout .. How far can this go now ?
#StockMarketindia #StocksToWatch #StocksToBuy #StocksToTrade #stocksToSell
More from Srihari MS
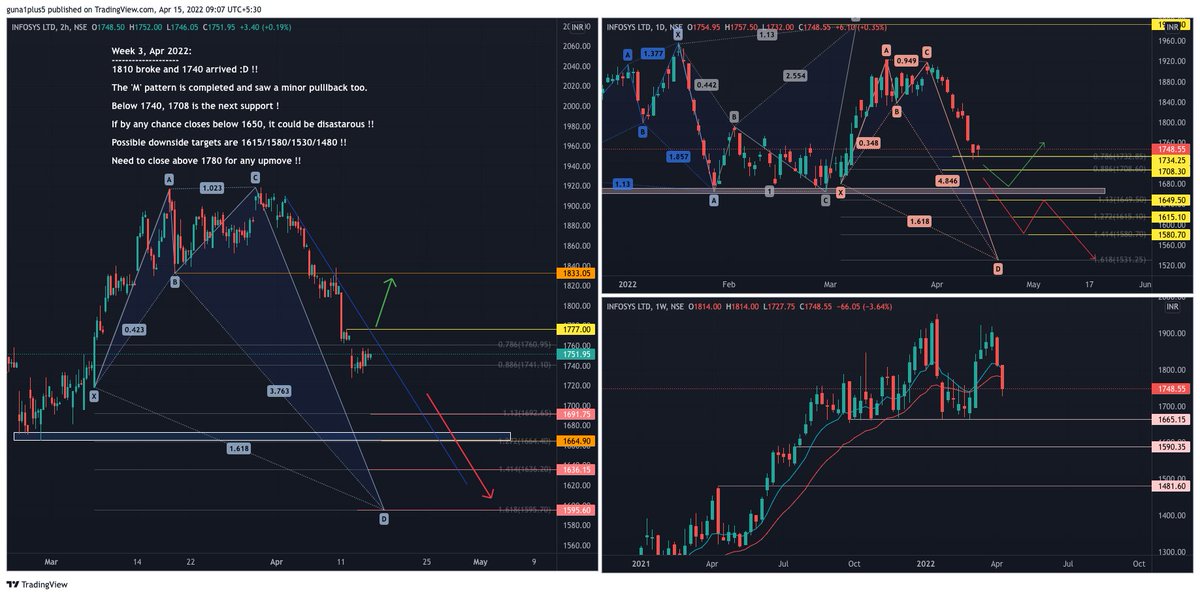
@niki_poojary My chart reading on #infy
@PRSundar64 @niki_poojary Low of 1590, the PRZ on the hourly charts ! Now 1650 will be a stiff resistance !!
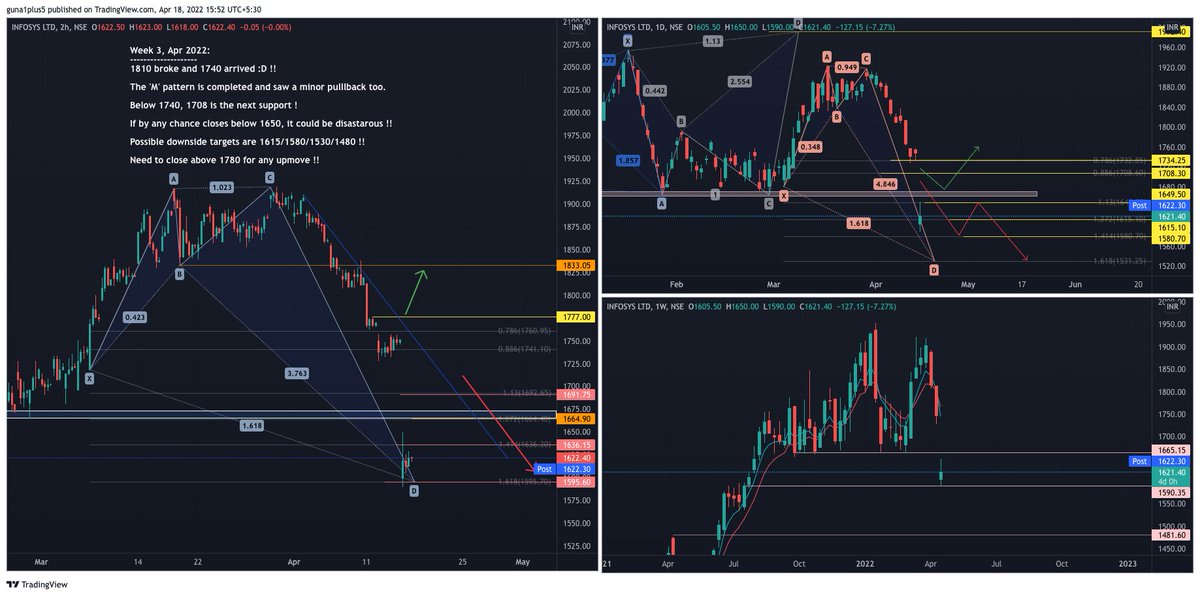
@PRSundar64 #infy update !
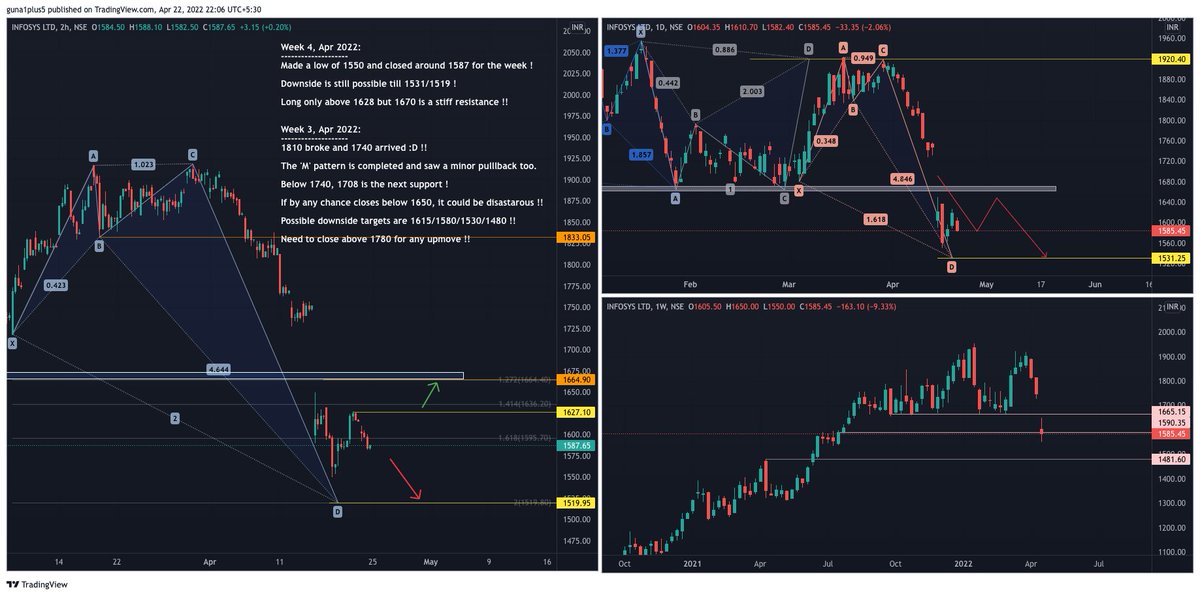
#Infosys weekly setup will turn terrible below 1650 - possible downside targets are marked in the chart
— Srihari MS (@mssrihari_rta) April 15, 2022
Hope 1650 saves one more time !! pic.twitter.com/caVBa8XndR
@PRSundar64 @niki_poojary Low of 1590, the PRZ on the hourly charts ! Now 1650 will be a stiff resistance !!
@PRSundar64 #infy update !


More from Mnm


You May Also Like


1/ 👋 Excited to share what we’ve been building at https://t.co/GOQJ7LjQ2t + we are going to tweetstorm our progress every week!
Week 1 highlights: getting shortlisted for YC W2019🤞, acquiring a premium domain💰, meeting Substack's @hamishmckenzie and Stripe CEO @patrickc 🤩
2/ So what is Brew?
brew / bru : / to make (beer, coffee etc.) / verb: begin to develop 🌱
A place for you to enjoy premium content while supporting your favorite creators. Sort of like a ‘Consumer-facing Patreon’ cc @jackconte
(we’re still working on the pitch)
3/ So, why be so transparent? Two words: launch strategy.
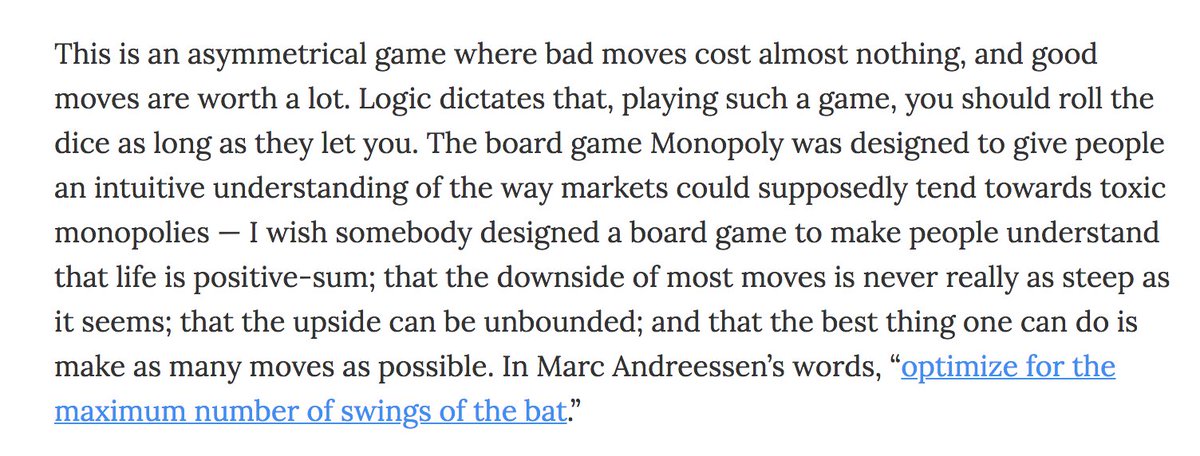
jk 😅 a) I loooove doing something consistently for a long period of time b) limited downside and infinite upside (feedback, accountability, reach).
cc @altimor, @pmarca
4/ https://t.co/GOQJ7LjQ2t domain 🍻
It started with a cold email. Guess what? He was using BuyMeACoffee on his blog, and was excited to hear about what we're building next. Within 2w, we signed the deal at @Escrowcom's SF office. You’re a pleasure to work with @MichaelCyger!
5/ @ycombinator's invite for the in-person interview arrived that evening. Quite a day!
Thanks @patio11 for the thoughtful feedback on our YC application, and @gabhubert for your directions on positioning the product — set the tone for our pitch!
Week 1 highlights: getting shortlisted for YC W2019🤞, acquiring a premium domain💰, meeting Substack's @hamishmckenzie and Stripe CEO @patrickc 🤩
2/ So what is Brew?
brew / bru : / to make (beer, coffee etc.) / verb: begin to develop 🌱
A place for you to enjoy premium content while supporting your favorite creators. Sort of like a ‘Consumer-facing Patreon’ cc @jackconte
(we’re still working on the pitch)
3/ So, why be so transparent? Two words: launch strategy.
jk 😅 a) I loooove doing something consistently for a long period of time b) limited downside and infinite upside (feedback, accountability, reach).
cc @altimor, @pmarca
4/ https://t.co/GOQJ7LjQ2t domain 🍻
It started with a cold email. Guess what? He was using BuyMeACoffee on his blog, and was excited to hear about what we're building next. Within 2w, we signed the deal at @Escrowcom's SF office. You’re a pleasure to work with @MichaelCyger!
5/ @ycombinator's invite for the in-person interview arrived that evening. Quite a day!
Thanks @patio11 for the thoughtful feedback on our YC application, and @gabhubert for your directions on positioning the product — set the tone for our pitch!