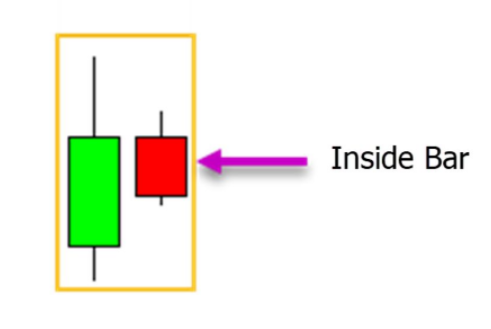
The inside bar pattern is a one candlestick pattern where price forms completely within the previous candlestick.
For an IB to be considered valid both the high and the low of the
candlestick or need to be completely inside the previous candle
2/n


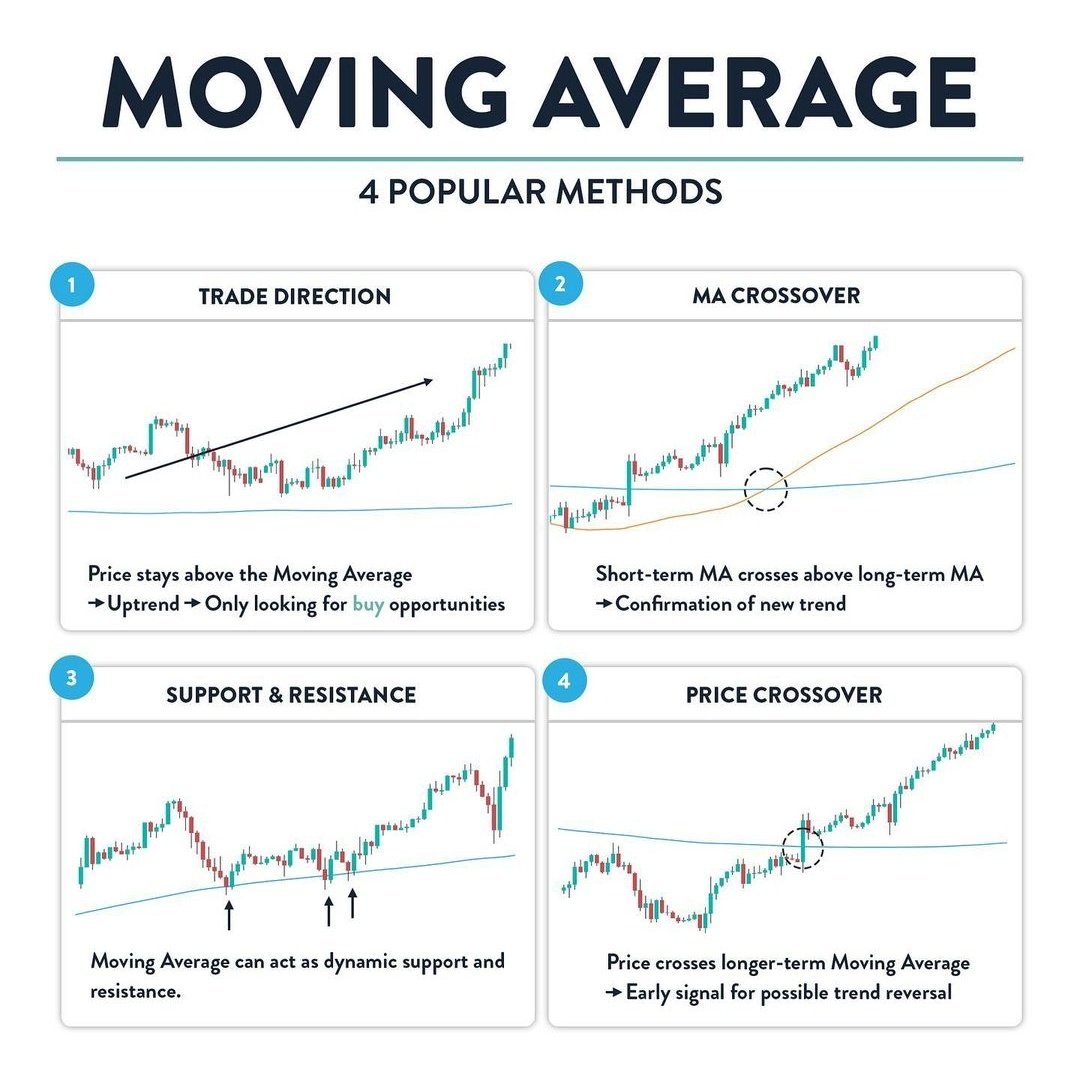
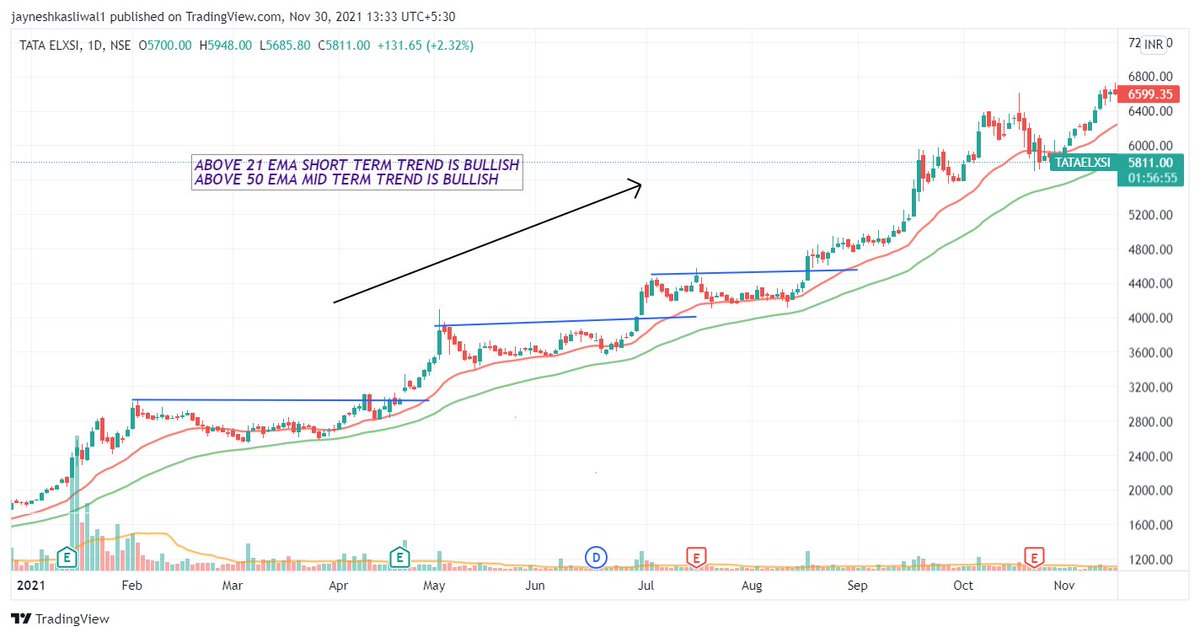
ULTIMATE GUIDE TO 21 and 200 Moving Average
— JayneshKasliwal (@JayneshKasliwal) November 14, 2021
SUNDAY THREAD \U0001f516
A trend Following System That will Help You Improve Trading immensely.
RETWEET AND SHARE \U0001f504@kuttrapali26 @AmitabhJha3 #stocks #StockMarket
1/n
Tik Tok pic.twitter.com/8X3oMxvncP
— Scotty Mar10 (@Allenma15086871) December 29, 2020