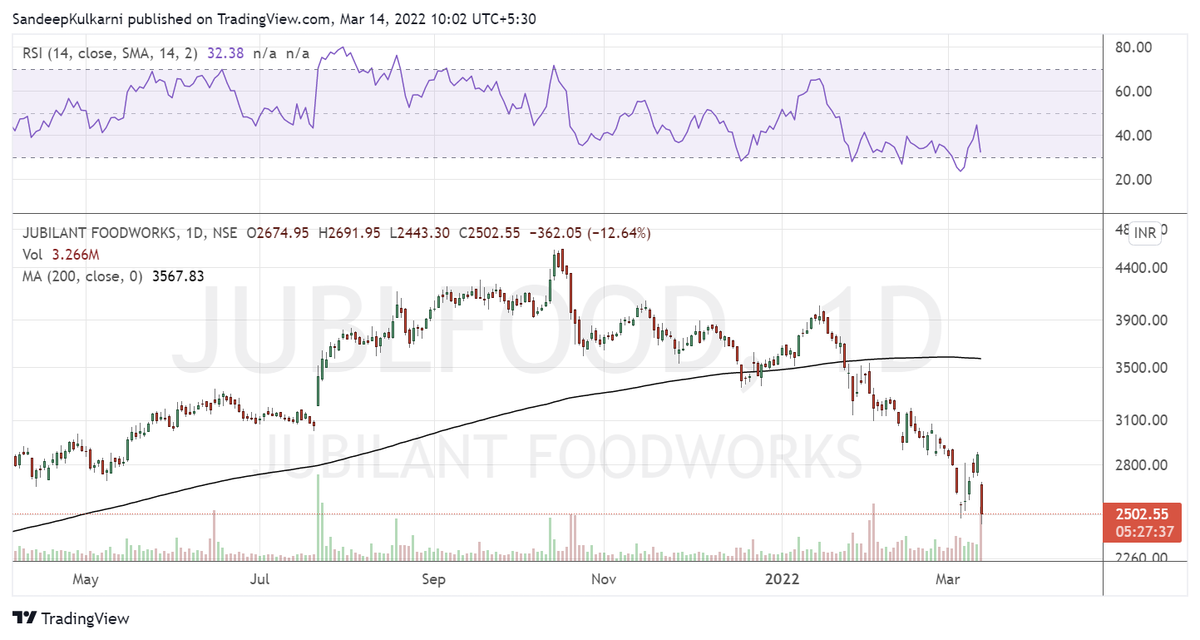
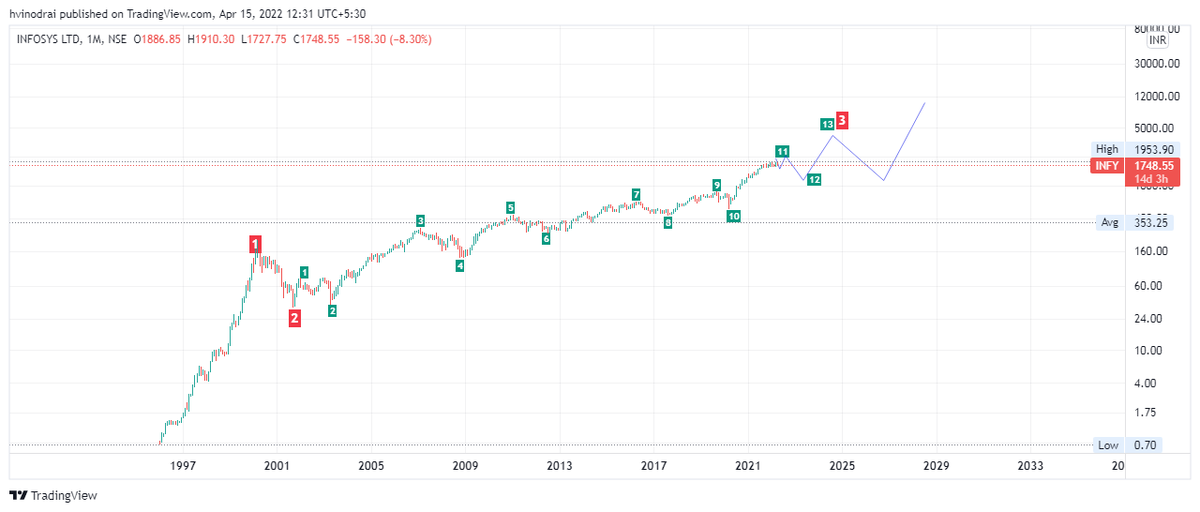
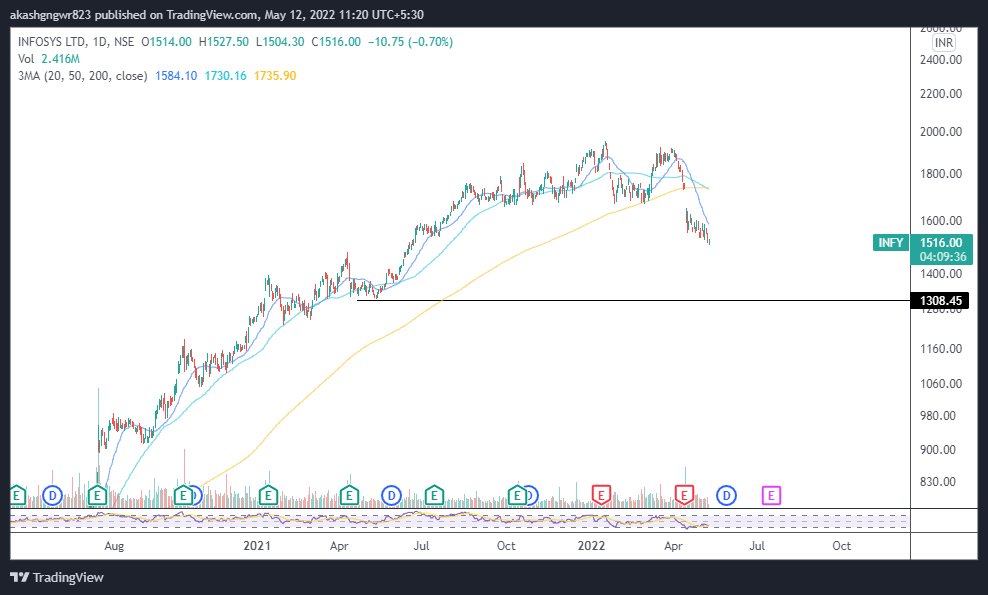
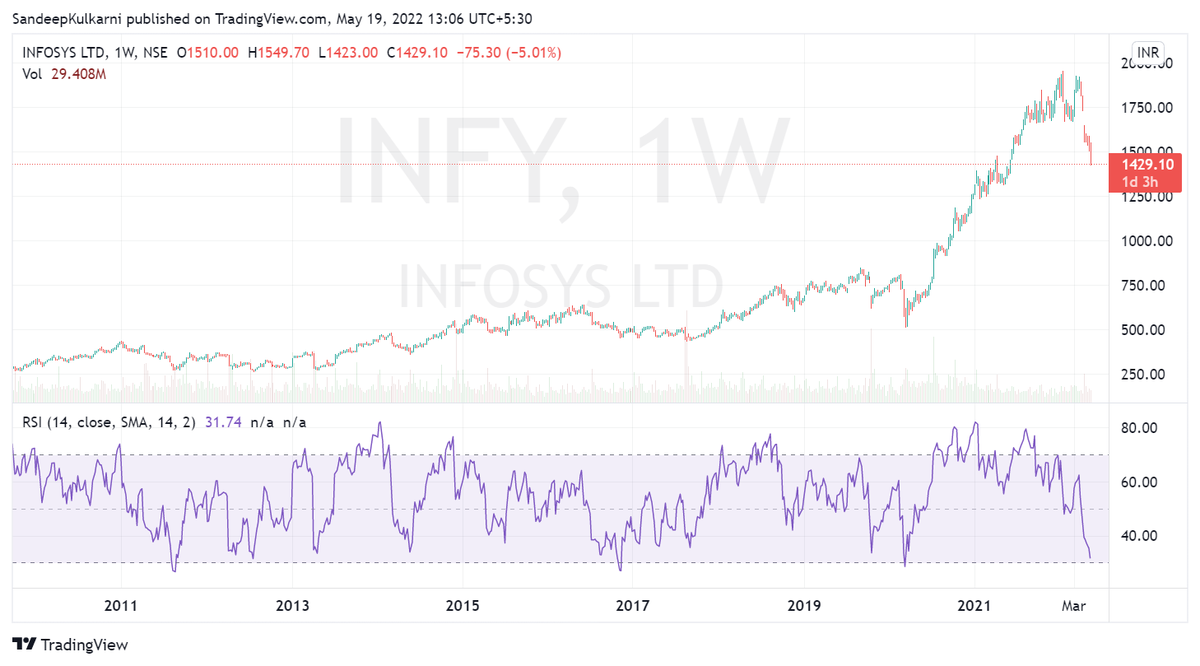
Infy which has been the flag bearer of IT sector has reached oversold levels on weekly where it has formed major bottoms.
Nifty IT as oversold on weekly as it was when it made major bottoms in Oct 2008, Aug 2011, Nov 2016 & Mar 2020.
More from Sandeep Kulkarni
This is Nifty's chart from 2004 to 2006. Back then also US interest rates had gone up. Markets had corrected well before Fed had hiked rates for first time in 2004, from then it hiked rates 17 times by 4.25% over next 2 yrs and yet market kept making new highs. @shivaji_1983 pic.twitter.com/EAFhske9EE
— Sandeep Kulkarni (@moneyworks4u_fa) February 11, 2022
BTW Nifty Metal has inverse correlation with USDINR. https://t.co/X6cqVcYF3V
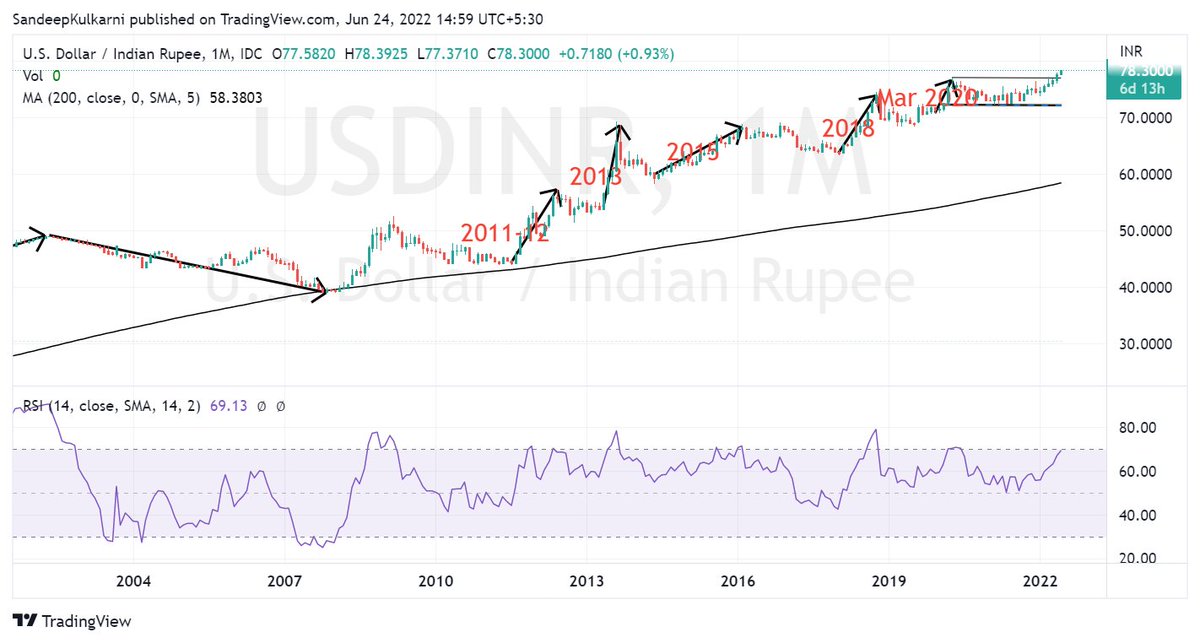
We know how our stock market has weathered the FII selling.
— Sandeep Kulkarni (@moneyworks4u_fa) June 10, 2022
But the equally big story is how Rupee has weathered $50bn+ outflows since Oct 2021. Hats off to RBI Governor Das & his team for having the vision of building huge reserves in his tenure. pic.twitter.com/CVuF9dM361
Infosys PEG ratio (1-year fwd PE/EPS growth) down to 1.4x from a peak of 2.7x as PE cut by 27% & EPS growth cut by 5% - trades at 23.3x PE for 11% FY23 growth. If this is a mid-cycle correction, its done BUT if this is the great valuation reset - more fall coming
— ThirdSide (@_ThirdSide_) May 25, 2022
Place your bets pic.twitter.com/9ZlaLDcxPZ
More from Infylongterm
Infosys PEG ratio (1-year fwd PE/EPS growth) down to 1.4x from a peak of 2.7x as PE cut by 27% & EPS growth cut by 5% - trades at 23.3x PE for 11% FY23 growth. If this is a mid-cycle correction, its done BUT if this is the great valuation reset - more fall coming
— ThirdSide (@_ThirdSide_) May 25, 2022
Place your bets pic.twitter.com/9ZlaLDcxPZ


