

Court proceedings are about to begin for Cleveland Grover Meredith, Jr., whom prosecutors say texted "War time" on the day of the insurrection after receiving a message "Pence blew it."
I'll cover it live, @LawCrimeNews.
Previously, via @AlbertoLuperon
Stand by.
He begins by arguing that interstate threats are a crime of violence, warranting continuing detention.
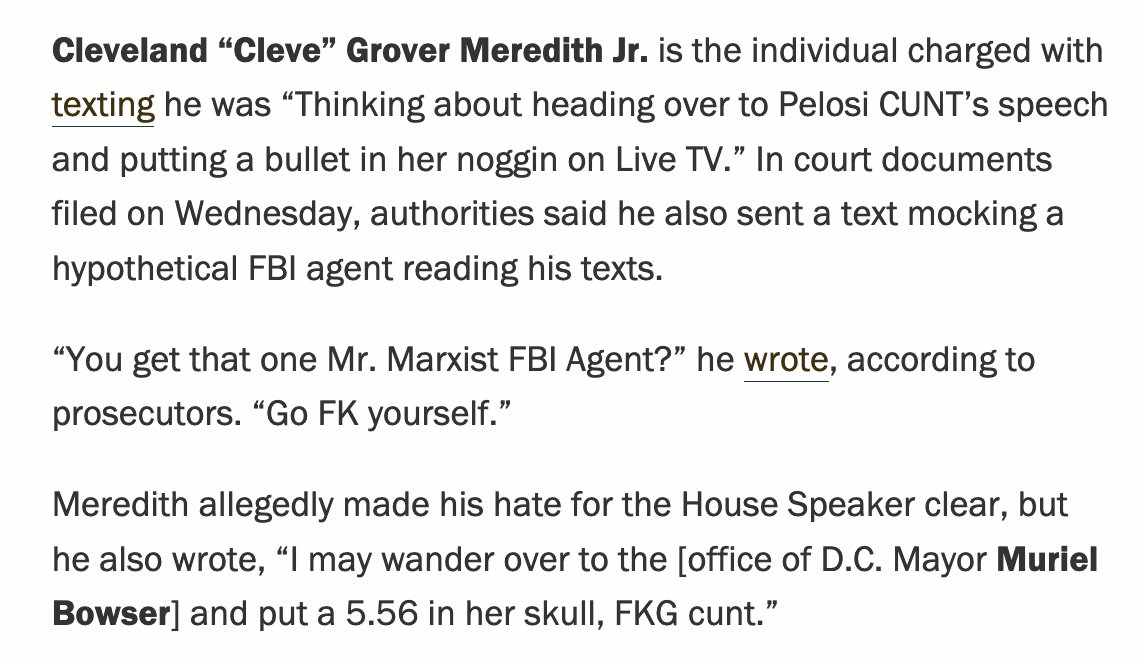
Meredith drove from Colorado to D.C. "to participate in a violent insurrection" on Jan. 6, which he called one of the most "hellish" days in the history of our nation's capitol.
Meredith wanted to use "armor piercing bullets," and it "just so happened" that this ammunition was found in his truck.
"Clearly this is someone who relished in the carnage," Baset said. "He relished, even after seeing what had happened."
The magistrate asks why.
Prosecutor: "His car malfunctioned, and he got here late."

More from Adam Klasfeld
More from Government

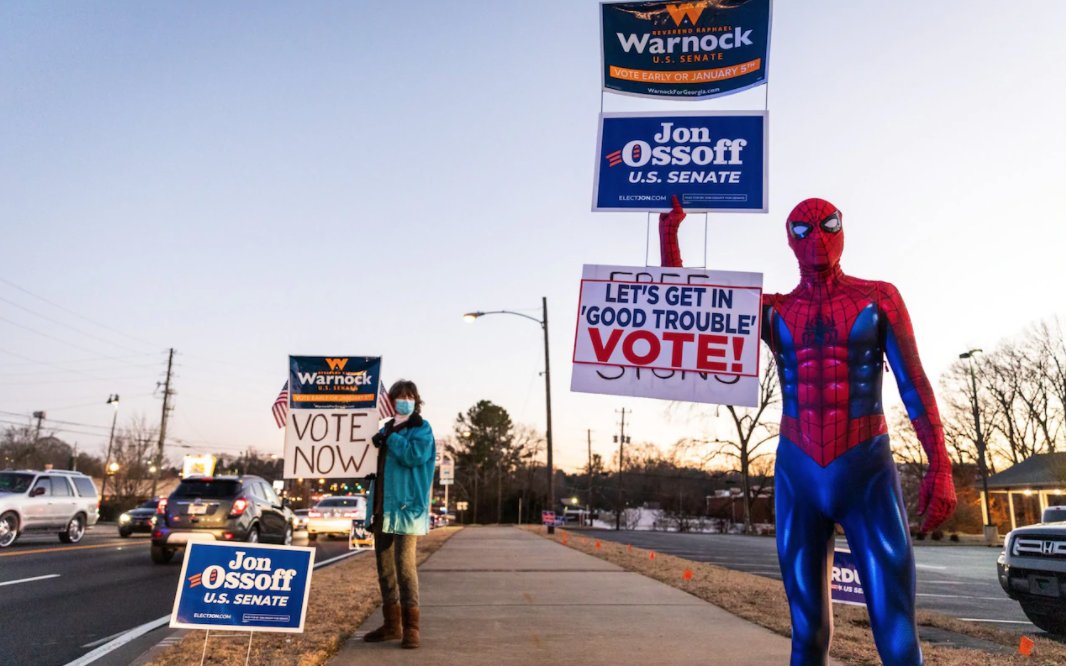
🔷 Rev. Raphael Warnock has become the first Democrat to win a Georgia Senate race in 20 years
The politician spoke to voters via MSNBC this morning
https://t.co/T9oJN2fjmo
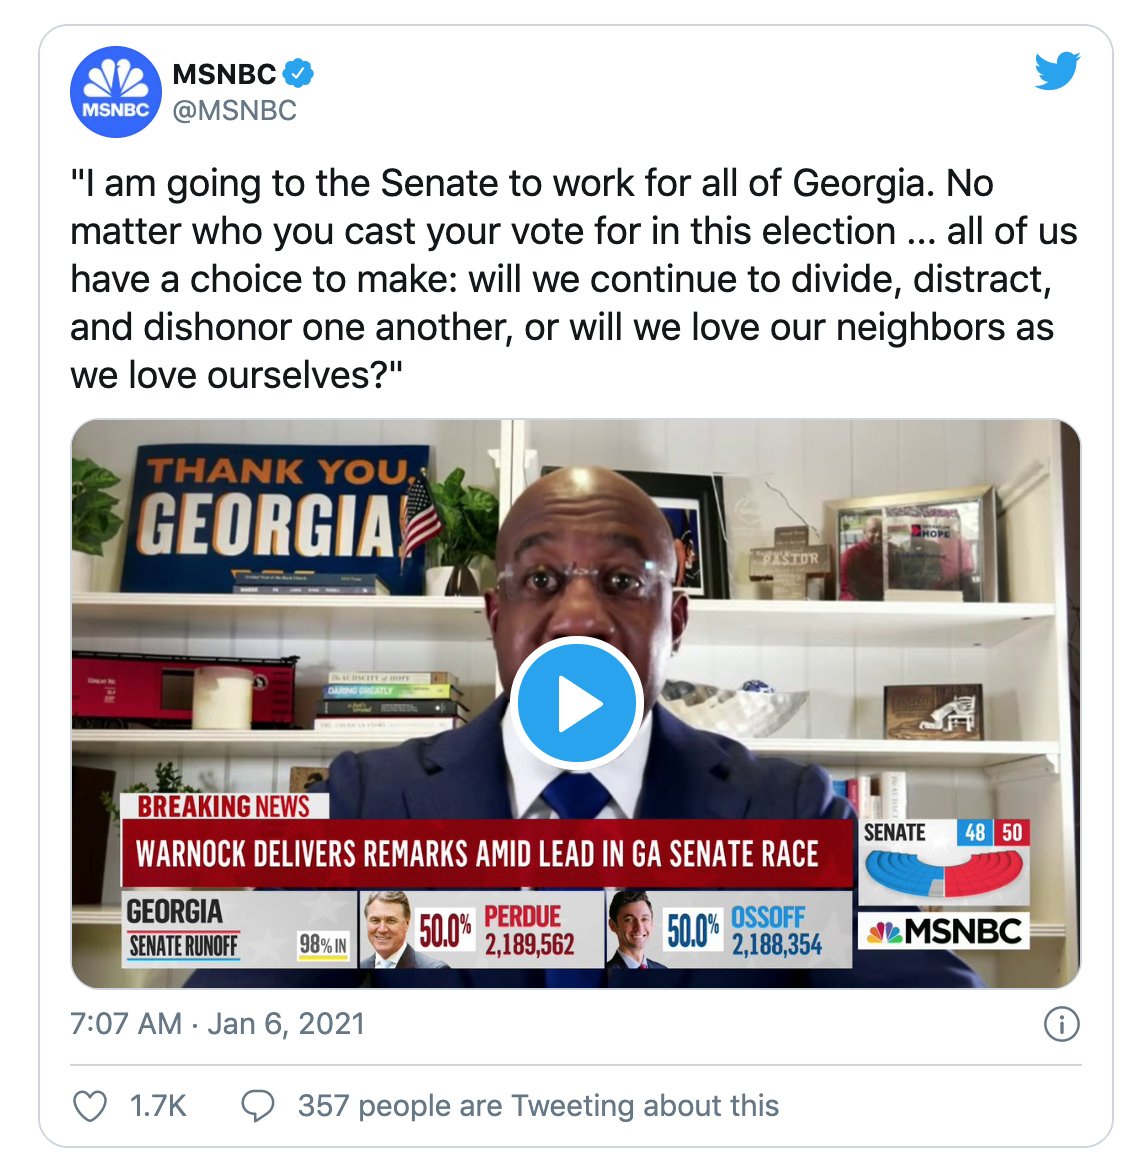
Warnock is a pastor at the Ebenezer Baptist Church in Atlanta where civil rights leader Martin Luther King once preached.
He will become Georgia's first Black senator
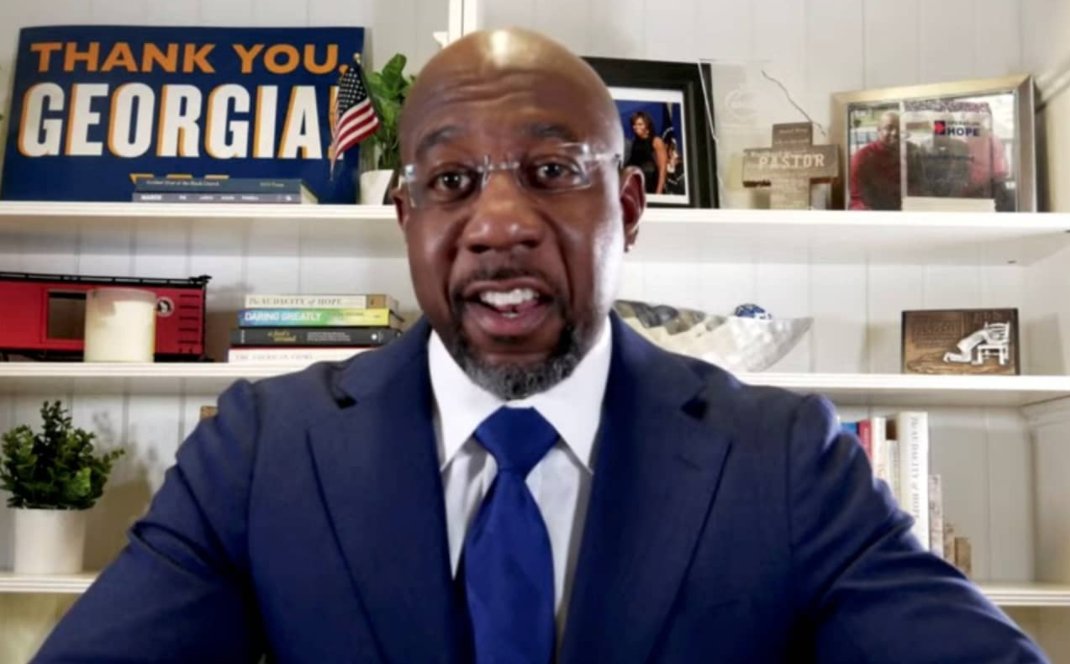
This blue victory gives the Democrats the chance to regain control of the Senate for at least the first two years of the Biden presidency
"With Biden proposing to reverse President Donald Trump's tax cut, increase the minimum wage, and strengthen oversight on various industries, some might argue that his agenda is not particularly market-friendly," says Vasu Menon, investment strategy director at OCBC Bank
The politician spoke to voters via MSNBC this morning
https://t.co/T9oJN2fjmo
Warnock is a pastor at the Ebenezer Baptist Church in Atlanta where civil rights leader Martin Luther King once preached.
He will become Georgia's first Black senator
This blue victory gives the Democrats the chance to regain control of the Senate for at least the first two years of the Biden presidency
"With Biden proposing to reverse President Donald Trump's tax cut, increase the minimum wage, and strengthen oversight on various industries, some might argue that his agenda is not particularly market-friendly," says Vasu Menon, investment strategy director at OCBC Bank

Canada is failing to act on Climate Change. @wef @WorldBank @IMFNews @IPCC_CH @UNDPGAIN @AntiCorruptIntl @Pontifex @JustinWelby @OCCRP @StopCorpAbuse @TaxJusticeNet @FairTaxCanada @ecojustice_ca @WCELaw @CanEnvLawAssn @envirodefence @IBA_Canada #cdnpoli
Covid recovery money is going to the oligarchy.
Ottawa and the provinces have put very little on the table to help clean-tech companies directly during Covid 19 while targeting fossil-fuel producers with more than $16 billion in aid.
Coast to coast people have demanded treaties be honored. We demanded climate action, divestment and land back but Canada is not listening. This video shows 10 years of rallies in Waterloo Ontario. City & regional council declared a climate emergency. 🚨
The Bank of China (BOC), SNC-Lavalin and WE Charity were recipients of taxpayer-funded the Covid 19 Canadian Emergency Wage Subsidy (CEWS)
Canada: Falling Far Short On Climate Policy, Emissions Reduction and Energy Transition #cdnpoli #bcpoli #alpolitics #onpoli @JimHarris @MikeHudema @SethDKlein @ElizabethMay @CitizensLobbyCa @lulex @kainagata https://t.co/jhm1TXvAKN pic.twitter.com/yEPINC5PTr
— Below2\xb0C (@Below2C_) December 29, 2020
Covid recovery money is going to the oligarchy.
Ottawa and the provinces have put very little on the table to help clean-tech companies directly during Covid 19 while targeting fossil-fuel producers with more than $16 billion in aid.
Coast to coast people have demanded treaties be honored. We demanded climate action, divestment and land back but Canada is not listening. This video shows 10 years of rallies in Waterloo Ontario. City & regional council declared a climate emergency. 🚨
The Bank of China (BOC), SNC-Lavalin and WE Charity were recipients of taxpayer-funded the Covid 19 Canadian Emergency Wage Subsidy (CEWS)


You May Also Like


The first area to focus on is diversity. This has become a dogma in the tech world, and despite the fact that tech is one of the most meritocratic industries in the world, there are constant efforts to promote diversity at the expense of fairness, merit and competency. Examples:
USC's Interactive Media & Games Division cancels all-star panel that included top-tier game developers who were invited to share their experiences with students. Why? Because there were no women on the
ElectronConf is a conf which chooses presenters based on blind auditions; the identity, gender, and race of the speaker is not known to the selection team. The results of that merit-based approach was an all-male panel. So they cancelled the conference.
Apple's head of diversity (a black woman) got in trouble for promoting a vision of diversity that is at odds with contemporary progressive dogma. (She left the company shortly after this
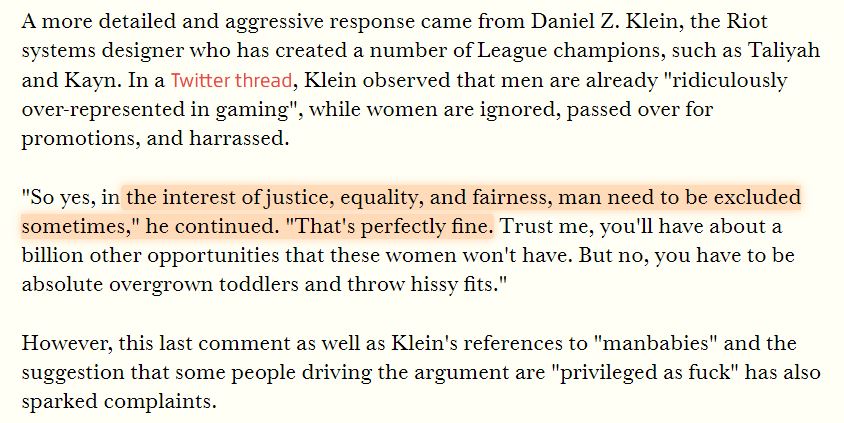
Also in the name of diversity, there is unabashed discrimination against men (especially white men) in tech, in both hiring policies and in other arenas. One such example is this, a developer workshop that specifically excluded men: https://t.co/N0SkH4hR35
USC's Interactive Media & Games Division cancels all-star panel that included top-tier game developers who were invited to share their experiences with students. Why? Because there were no women on the
ElectronConf is a conf which chooses presenters based on blind auditions; the identity, gender, and race of the speaker is not known to the selection team. The results of that merit-based approach was an all-male panel. So they cancelled the conference.
Apple's head of diversity (a black woman) got in trouble for promoting a vision of diversity that is at odds with contemporary progressive dogma. (She left the company shortly after this
Also in the name of diversity, there is unabashed discrimination against men (especially white men) in tech, in both hiring policies and in other arenas. One such example is this, a developer workshop that specifically excluded men: https://t.co/N0SkH4hR35
