Categories Gold
7 days
30 days
All time
Recent
Popular

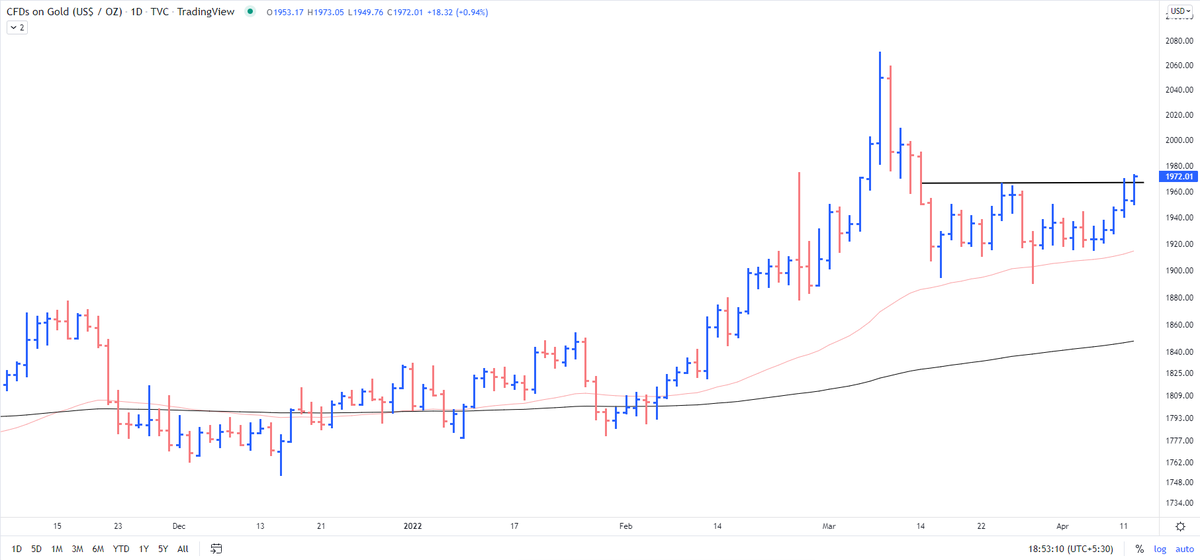
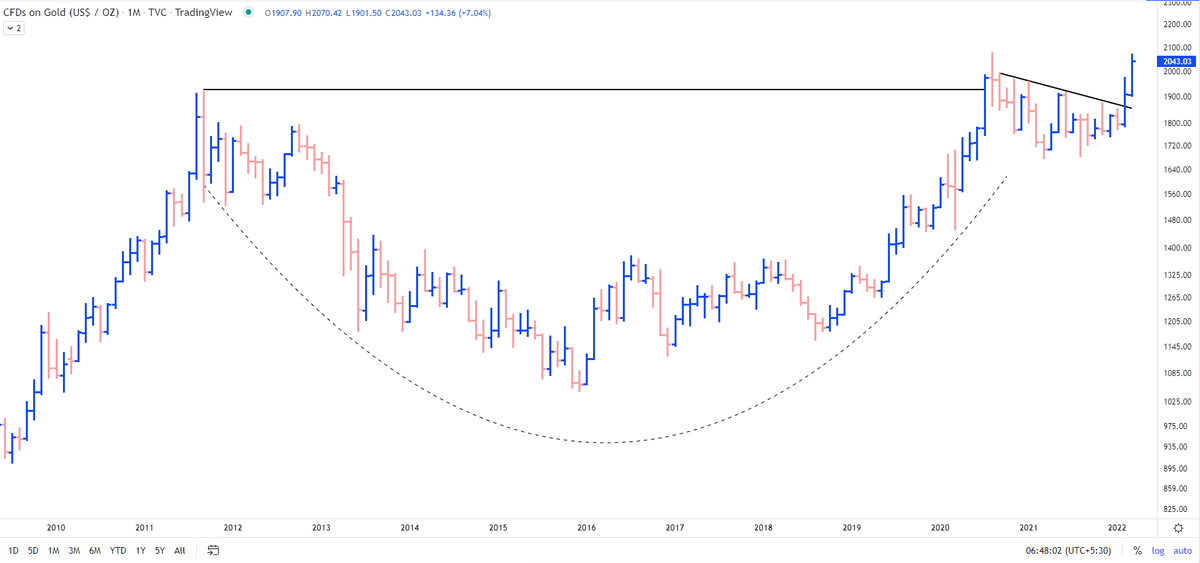
Fast forward to today when I added Gold at 1850. It made a sharp-up move but didn't want to sell for the sake of hedging. The positions were scaled up around 1925 with the fresh SL of 1900.
So far doing good. 2000 is the level I would be looking for. https://t.co/j1kiKRSx0y
So far doing good. 2000 is the level I would be looking for. https://t.co/j1kiKRSx0y
GOLD - 1 9 2 7 from 1 8 5 0
— The_Chartist \U0001f4c8 (@charts_zone) February 24, 2022
No indicators, nothing. Understand the language of the price. https://t.co/l6pEGD7r6D pic.twitter.com/JWZjlTLSBF

90% of my savings were in equity, debt was never attractive! Last few months have taught me the imp of diversification!
Gold - through SGBs was my move on diversifying! Holder since Jan'20 - so far so good!
A🧵on talk given by @PositiveGamma on Investing in Gold!
(1/16)

Link to the here - https://t.co/NxEkVKZi2H
MMTC PAMP is where Krishna worked before Setu and he was also responsible for launching Digi Gold at PayTM!
1) Why Gold?
1.1 Diversification - Volatility & Returns not tied to market conditions - diff. from financial assets.
(2/16)
1.2 Safe Haven - High value asset, easy to transport! Large value - limited space. Liquid and easy to convert to cash across the world.
1.3 Hedge against inflation and currency depreciation! (Depreciation of Rupee is a major factor behind Gold returns in India)
(3/16)
1.4 Upside in Tail Risk - Confidence in currencies & financial systems is low, gold can see upside in scenarios like this!
1.5 Upside on Demand/Supply - Constant Demand - Supply is stable!
2) Gold - Indian Context - Better returns compared to other asset classes...
(4/16)
... specially in the last 2-3 years. Gold has done well both in low inflation & high inflation returns. So both real (ex. inflation) & nominal returns have been good!
3) How much to Allocate?
3.1 Diversification/Inflation Hedge - 10-20%
3.2 Tail Risk/Safe Haven - 5-20%
(5/16)
Gold - through SGBs was my move on diversifying! Holder since Jan'20 - so far so good!
A🧵on talk given by @PositiveGamma on Investing in Gold!
(1/16)
Link to the here - https://t.co/NxEkVKZi2H
MMTC PAMP is where Krishna worked before Setu and he was also responsible for launching Digi Gold at PayTM!
1) Why Gold?
1.1 Diversification - Volatility & Returns not tied to market conditions - diff. from financial assets.
(2/16)
1.2 Safe Haven - High value asset, easy to transport! Large value - limited space. Liquid and easy to convert to cash across the world.
1.3 Hedge against inflation and currency depreciation! (Depreciation of Rupee is a major factor behind Gold returns in India)
(3/16)
1.4 Upside in Tail Risk - Confidence in currencies & financial systems is low, gold can see upside in scenarios like this!
1.5 Upside on Demand/Supply - Constant Demand - Supply is stable!
2) Gold - Indian Context - Better returns compared to other asset classes...
(4/16)
... specially in the last 2-3 years. Gold has done well both in low inflation & high inflation returns. So both real (ex. inflation) & nominal returns have been good!
3) How much to Allocate?
3.1 Diversification/Inflation Hedge - 10-20%
3.2 Tail Risk/Safe Haven - 5-20%
(5/16)

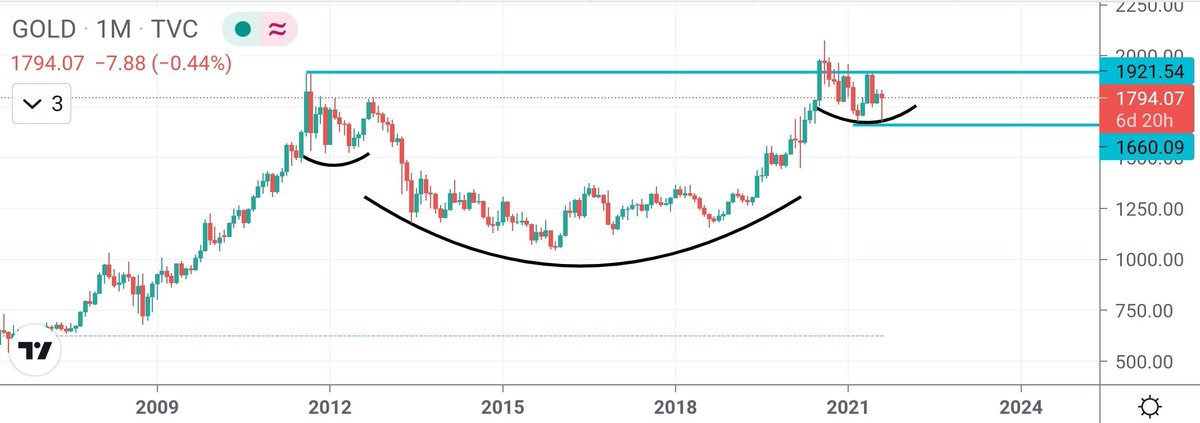


What my simple analysis showed was the decadal breakout in making in #Gold along with the outperformance over S&P500 #SPX
Result?
1850$ to 2070$
Updated chart https://t.co/l6pEGD7r6D
Result?
1850$ to 2070$
Updated chart https://t.co/l6pEGD7r6D
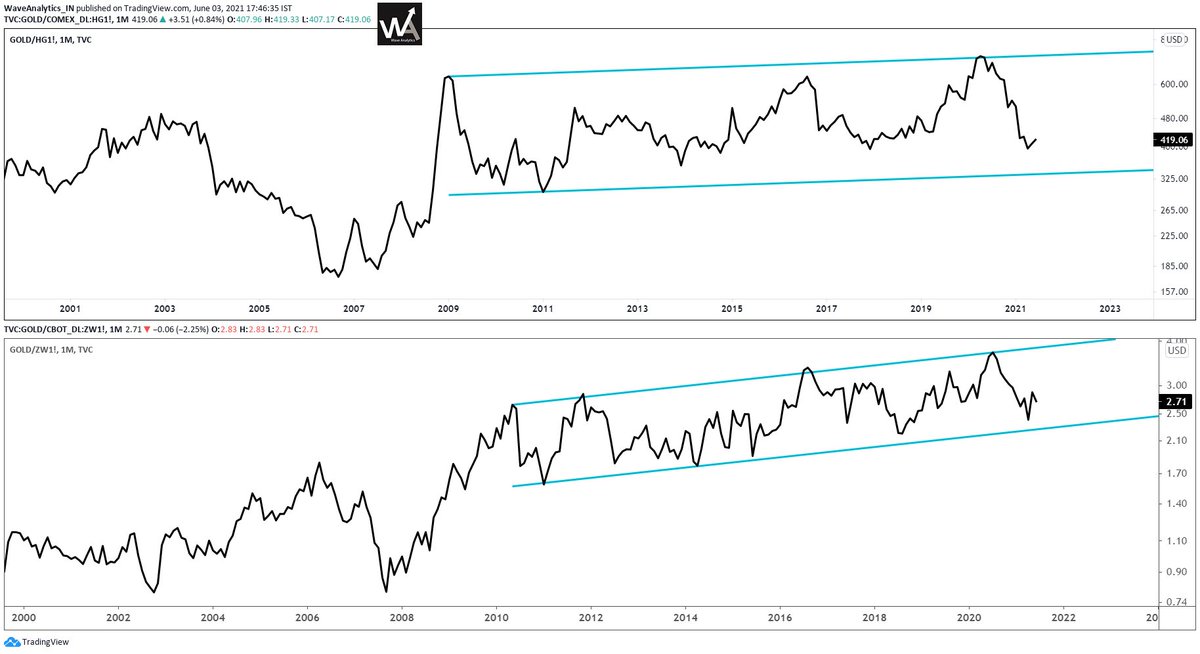
Most interesting chart:
— The_Chartist \U0001f4c8 (@charts_zone) February 12, 2022
Orange line = Gold
Blue Curve = Gold/S&P 500
Previously the ratio crossed 50 days MA in Feb' 20 with Gold giving a breakout on the charts. The previous cross of 50 days MA didn't result in gold breaking out. pic.twitter.com/HRG1fvsILp


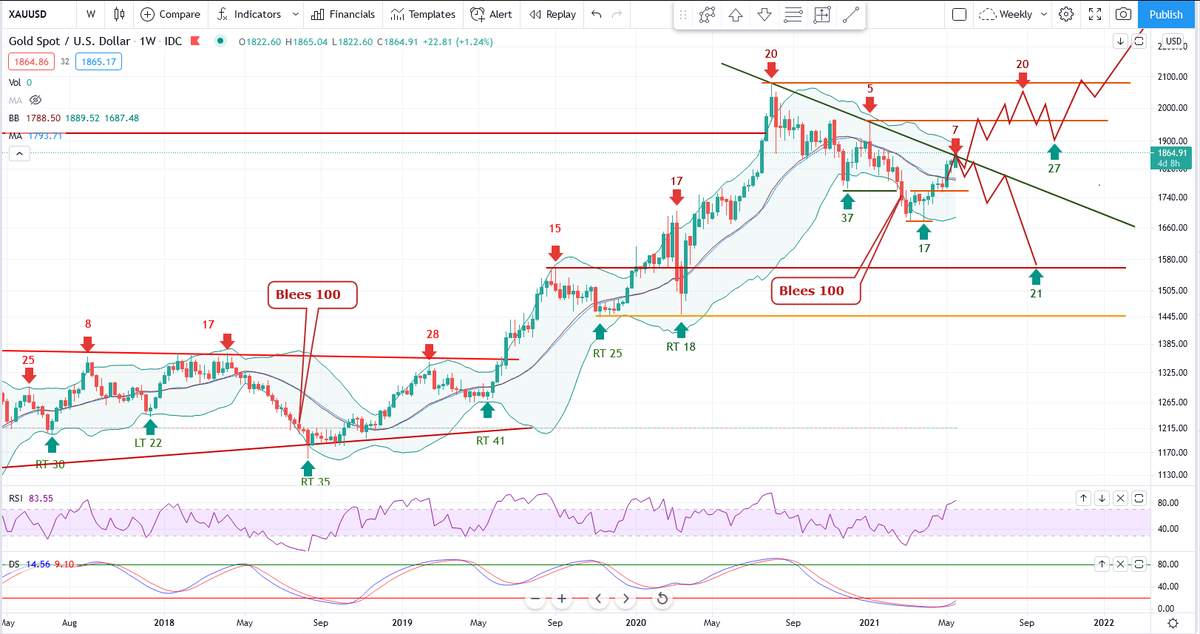
From 1850 to 1990$ - the GOLD is getting more interesting. I will be adding up more if the resistance is taken off and the price follows through.
GOLD https://t.co/l6pEGDpAkL
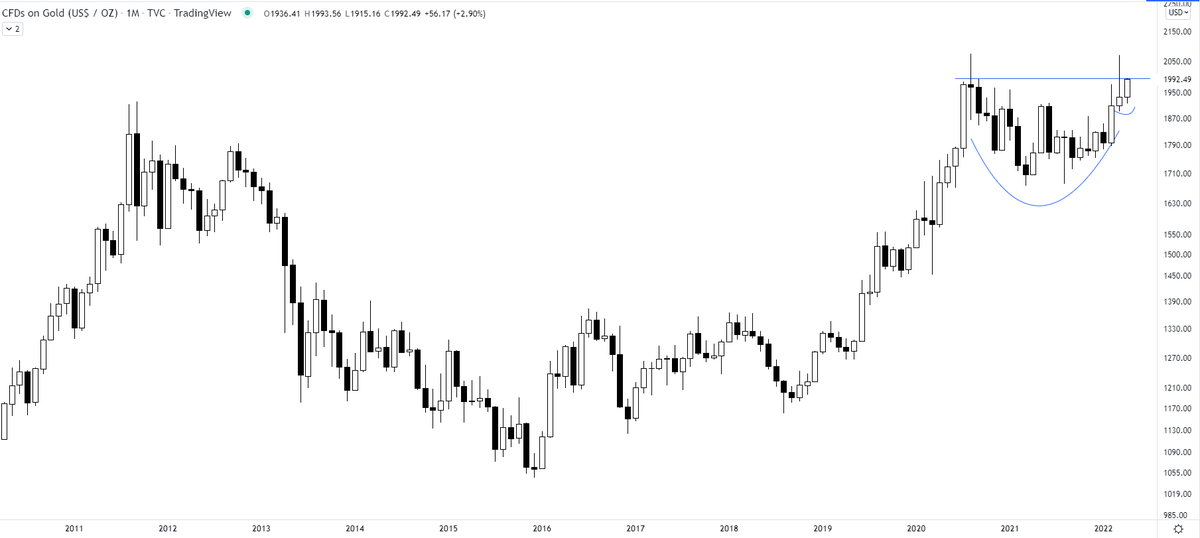
GOLD https://t.co/l6pEGDpAkL
Most interesting chart:
— The_Chartist \U0001f4c8 (@charts_zone) February 12, 2022
Orange line = Gold
Blue Curve = Gold/S&P 500
Previously the ratio crossed 50 days MA in Feb' 20 with Gold giving a breakout on the charts. The previous cross of 50 days MA didn't result in gold breaking out. pic.twitter.com/HRG1fvsILp