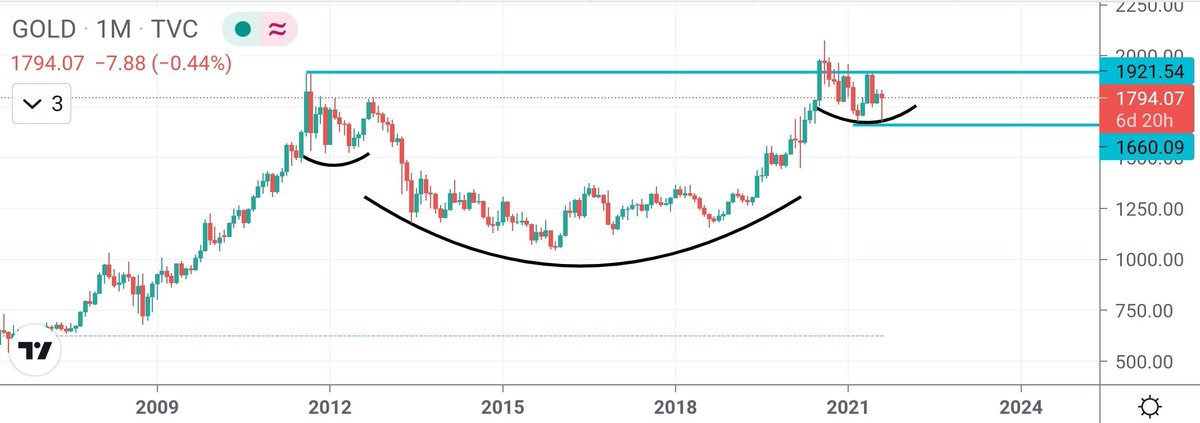
GOLD: I don't understand what's so complicated about Gold.
Below 1920: Must avoid.
Above 1920 on weekly and monthly closing basis: Breakout of epic proportions.
More from Mayank Narula

More from Gold


Just a coincidence?
This might be the best gold analog chart i have ever seen. When you overlap the yellow 1970-1980 inflationary gold bull market over the green 1999-2021 #gold bull the correlation is unbelievable. Chart from Mike Maloney. Protect your fiat holdings from oncoming inflation. $GLD pic.twitter.com/R9Hyl9Nwe3
— Edward Gofsky (@EdwardGofsky) May 10, 2021


You May Also Like


Took me 5 years to get the best Chartink scanners for Stock Market, but you’ll get it in 5 mminutes here ⏰
Do Share the above tweet 👆
These are going to be very simple yet effective pure price action based scanners, no fancy indicators nothing - hope you liked it.
https://t.co/JU0MJIbpRV
52 Week High
One of the classic scanners very you will get strong stocks to Bet on.
https://t.co/V69th0jwBr
Hourly Breakout
This scanner will give you short term bet breakouts like hourly or 2Hr breakout
Volume shocker
Volume spurt in a stock with massive X times
Do Share the above tweet 👆
These are going to be very simple yet effective pure price action based scanners, no fancy indicators nothing - hope you liked it.
https://t.co/JU0MJIbpRV
52 Week High
One of the classic scanners very you will get strong stocks to Bet on.
https://t.co/V69th0jwBr
Hourly Breakout
This scanner will give you short term bet breakouts like hourly or 2Hr breakout
Volume shocker
Volume spurt in a stock with massive X times