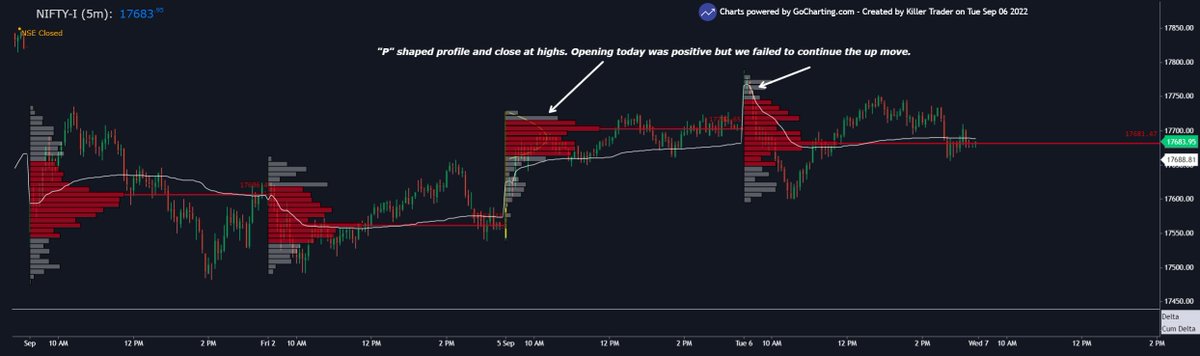
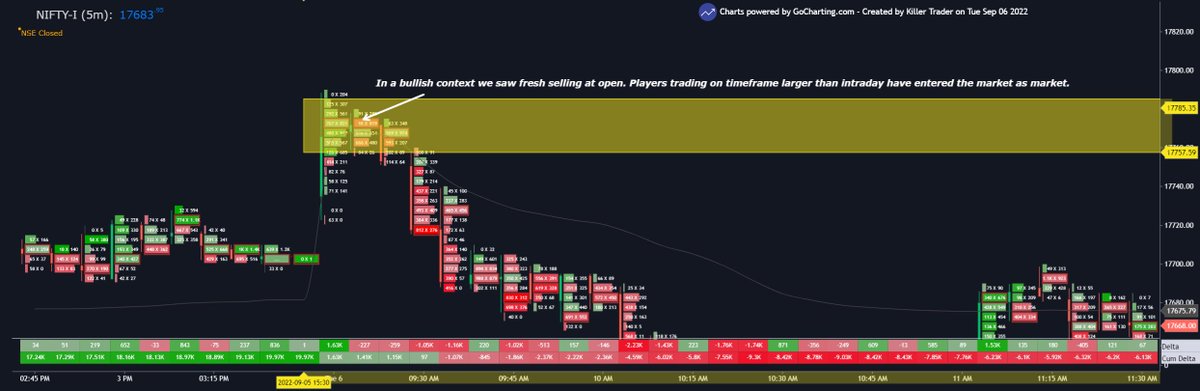
Example:
Mr. X marked 1500 as a strong support in HDFC Bank. Next day, stock opened at 1510, came down and hit 1500.
ABC went long in the stock. A few minutes later, stop got triggered. What went wrong here?
(2/n)
1500 is support for HDFC bank as per Mr. X but he did not wait to check if market validated his opinion.
At supports and resistances marked by a trader (you), wait for market to show the stock is actually taking support/resistance at those levels.
(3/n)
For your analysis to be correct, market buying>selling at support, market selling>buying at resistance.
Essentially, on a lower TF, check for bullish price action at support, bearish price action at resistance before you enter the trade.
(4/n)
Remember that no support is too low to be broken and no resistance is too high to be broken.
(5/n)
2. Having the same timeframes for analysis and trading:
If you are a price action based trader, the most important guiding principle for you is:
1. Higher the timeframe, more accurate and reliable the technical analysis
2. But big moves start on small timeframes first.
(6/n)
Both sound contrarian? Yes, they do.
The key is to balance these two principles and have a structure where you analyze markets on a TF and trade on a TF which complement each other.
(7/n)
Example:
If you are a day trader, do not pick stocks on 15 mins TF and trade on 15 mins. Switch your analysis to hourly TF/daily TF.
It will help avoid choppiness in the markets to a large extent.
(8/n)
3. Taking reversal trades based on divergences:
A divergence is a signal for a potential reversal which MAY occur, but not a confirmation.
Just taking reversal bets on divergence will sooner or later burn big holes in your pocket.
(9/n)
To trade any divergence, have a structured rule based action, (Ex: I use fibs to validate divergences) and then take reversal trades after PRICE CONFIRMTION.
Every divergence does not mean reversal and every reversal does not come with divergence.
(10/n)
4. Using multiple oscillators:
Some people use RSI, MACD, Stoch RSI all on one chart.
On a minute basis, even though these oscillators have their own differences, fundamentally on a broader perspective, they have the same purpose.
(11/n)
Doesn't matter whether you use a analog watch or a digital watch, primary purpose is to check time.
So, pick one oscillator and do not clutter your chart and minds in live markets.
(12/n)
Relying too much on candle patterns:
This could get a bit unpopular but I like to put the truth out:
Bullish candle patterns work well in bull markets and bearish patterns work well in bear markets.
(13/n)
But on the whole, deciding the direction of a stock and taking a trade just based on "one single candle pattern" is injurious to account in the longer run.
(14/n)
Focus on understanding the market mechanism.
Deciding the direction based on just 1 candle without considering the positions of market participants of different timeframes is not a good practice.
Focus on developing an analysis method based on multiple factors.
(15/n)
Hope you liked the contents of this thread. If yes, like and re-tweet.
Follow me to get more such content and knowledge
#stockmarkets #trading #Nifty