THREAD AWS $AMZN
AMZN has 15Xed in 6 years (~$60bn->~$1tr). Along the way there have been many investor concerns, which have in hindsight been "can't see the forest for the trees" nitpicks: 1) AWS not profitable; 2) AWS price cuts; 3) Depr acctg; 4) Too much start up exposure.

Looking back on it, it is funny to think about a few of the past AWS bear cases/worries:
AMZN first disclosed AWS financials on the 1Q15 print. Before AMZN disclosed AWS revs/EBIT, the consensus was the MORE unprofitable AWS was, the better it was for AMZN’s stock because it meant the retail business was even more profitable than people thought.

After AMZN disclosed the AWS metrics, valuation hawks jumped all over the AWS disclosures. 50% adj. EBITDA margin were masked by 1) capital leases and 2) depreciation shenanigans.
I remember the 2015/16 tech downturn vividly. I was on the sell side covering smidcap internet. Almost half of my smidcap Internet names down 40+% earnings in November 2015.

More from Finance


Having made over 1000 boxes for vulnerable families in Cambridge via @RedHenCambridge (thanks to our customers 🙏🏽) My thoughts on the £30 box thing. Lots of factors at play here. 1/
If the pics in this @BootstrapCook thread are true and correct then the Govt/taxpayers & families in need are getting absolutely SHAFTED 👇🏽 2/
There are some mitigating circumstances. A £30 box won’t ever contain £30 (retail) worth of food - people aren’t factoring in
-the cost of the box
-paying someone to fill it
-rent & rates
-& most expensive the *transport/distribution*
3/
If you’re doing the above at scale. Delivering *across the UK* it’s not cheap BUT IMHO there should be at LEAST £20 worth of groceries in a £30 box. To get more value they need more fresh produce. Just carrots & apples is terrible. 4/
I’m gonna put my rep on the line here & say something about these big national catering companies whose names I’ve seen mentioned. They are an ASSHOLE to deal with & completely shaft small businesses like mine with their terms which is why I won’t deal with them. 5/
If the pics in this @BootstrapCook thread are true and correct then the Govt/taxpayers & families in need are getting absolutely SHAFTED 👇🏽 2/
Hi all. I\u2019ve been sent LOTS of photos of the food parcels that have replaced the \xa330 vouchers and asked what I would do with them. I\u2019m replying with advice privately because to do so publicly would look like justifying these ill thought through, offensively meagre scraps /1.
— Jack Monroe (@BootstrapCook) January 11, 2021
There are some mitigating circumstances. A £30 box won’t ever contain £30 (retail) worth of food - people aren’t factoring in
-the cost of the box
-paying someone to fill it
-rent & rates
-& most expensive the *transport/distribution*
3/
If you’re doing the above at scale. Delivering *across the UK* it’s not cheap BUT IMHO there should be at LEAST £20 worth of groceries in a £30 box. To get more value they need more fresh produce. Just carrots & apples is terrible. 4/
I’m gonna put my rep on the line here & say something about these big national catering companies whose names I’ve seen mentioned. They are an ASSHOLE to deal with & completely shaft small businesses like mine with their terms which is why I won’t deal with them. 5/


Inflation is coming, inflation is coming!
Last month I wrote about the distinction between long-term secular inflation and shorter-term cyclical inflation
It has been clear for several months that we are in the middle of a cyclical rise in
The full thread can be reviewed here:
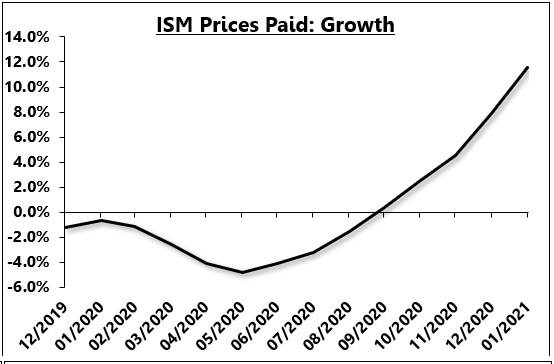
Today's PPI report should have been expected to surprise to the upside as the leading indicators of inflation have been screaming to the upside for months!
Here is the ISM prices paid index, cumulated into a growth rate
3/
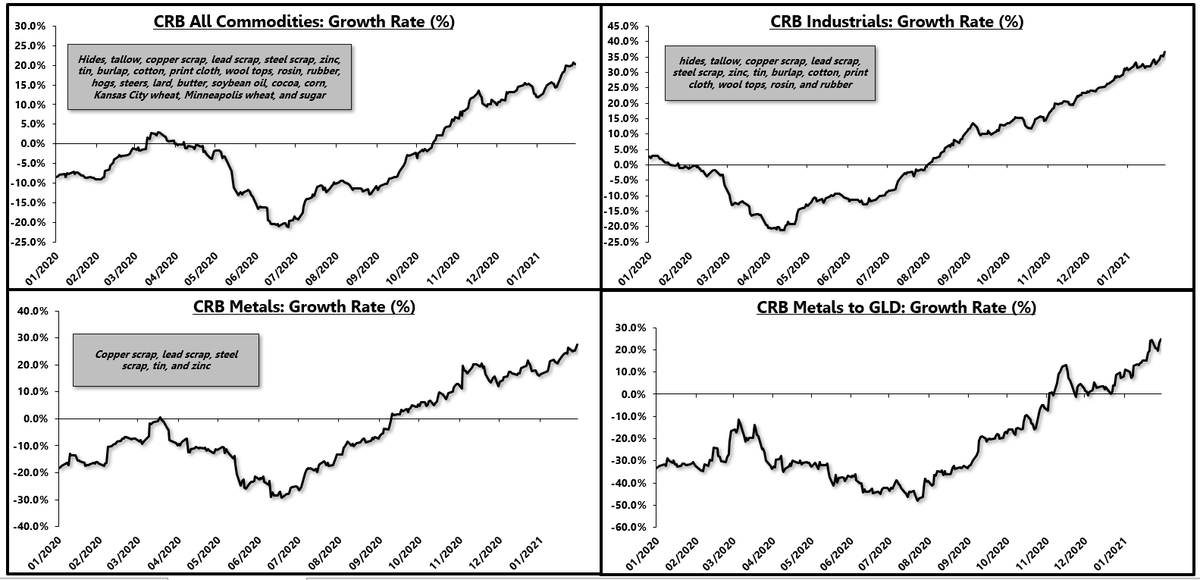
Industrial commodity prices have also seen a major acceleration for months.
4/
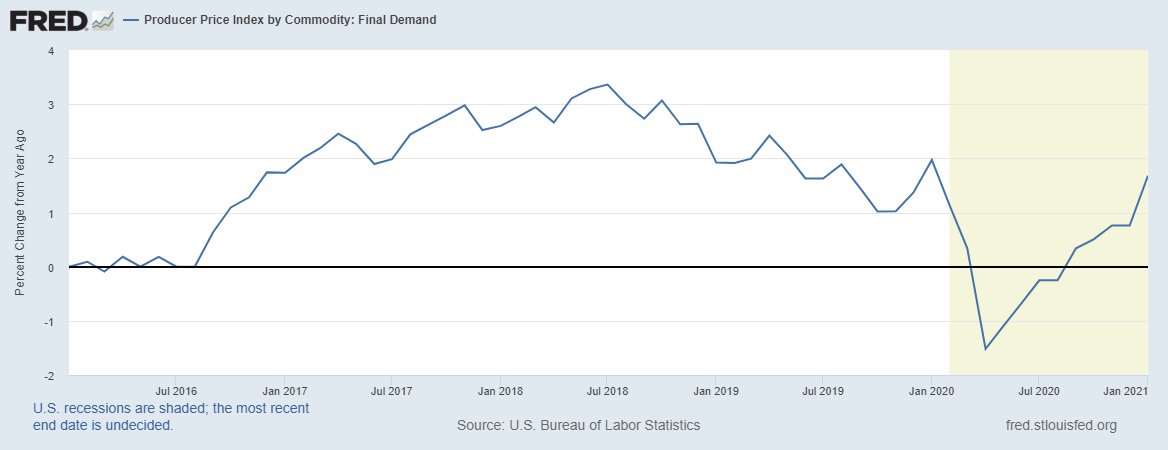
So today's PPI report was in line with the leads, suggesting that we have a cyclical upturn in inflation that is * primarily concentrated in the manufacturing sector *
This is a key point.
5/
Last month I wrote about the distinction between long-term secular inflation and shorter-term cyclical inflation
It has been clear for several months that we are in the middle of a cyclical rise in
Now, in the short-term, the manufacturing sector is red hot, driven by a pent-up demand rebound in goods consumption.
— Eric Basmajian (@EPBResearch) January 4, 2021
Commodity prices are screaming which gives legs to "goods" inflation in the short-term.
8) pic.twitter.com/rQcqHf1OD0
The full thread can be reviewed here:
Consensus continues to conflate the inflation story, mixing and matching long-term and short-term charts to fit what is generally a secular inflation narrative.
— Eric Basmajian (@EPBResearch) January 4, 2021
Here are my two cents to make the distinction clear.
1)
Today's PPI report should have been expected to surprise to the upside as the leading indicators of inflation have been screaming to the upside for months!
Here is the ISM prices paid index, cumulated into a growth rate
3/
Industrial commodity prices have also seen a major acceleration for months.
4/
So today's PPI report was in line with the leads, suggesting that we have a cyclical upturn in inflation that is * primarily concentrated in the manufacturing sector *
This is a key point.
5/

You May Also Like


A list of cool websites you might now know about
A thread 🧵
1) Learn Anything - Search tools for knowledge discovery that helps you understand any topic through the most efficient
2) Grad Speeches - Discover the best commencement speeches.
This website is made by me
3) What does the Internet Think - Find out what the internet thinks about anything
4) https://t.co/vuhT6jVItx - Send notes that will self-destruct after being read.