Ivor Cummins BE (Chem) is a former R&D Manager at HP (sourcre: https://t.co/Wbf5scf7gn), turned Content Creator/Podcast Host/YouTube personality. (Call it what you will.)
— Steve (@braidedmanga) November 17, 2020
Ivor Cummins has been wrong (or lying) almost entirely throughout this pandemic and got paid handsomly for it.
He has been wrong (or lying) so often that it will be nearly impossible for me to track every grift, lie, deceit, manipulation he has pulled. I will use...

19 to 80 is an over 300% difference.
Tweet: https://t.co/36FnYnsRT9

I wonder why...
Tweets: https://t.co/XLfoX4rpck / https://t.co/vjE1ctLU5x

Tweets: https://t.co/vcDpTu3qyj / https://t.co/CA3N6hC2Lq

Tweet: https://t.co/gQs2G0pFCF
Video: https://t.co/4mpZKXIgKQ
Final graph with all restrictions for Ireland @StuartDNeilson

various goalpost shifting, ignorance of facts, logic, data, science
h/t @jocami_ca
https://t.co/JjvZfNAxgp
^ Ivor's theme of Lockdowns don't work, don't match the papers' findings.
https://t.co/CatJd5PV3H
https://t.co/7EcJnkfFXK ---
Ivor's widespread video debunked: https://t.co/7EcJnkfFXK
source video: https://t.co/Pq4u5RgMS7
Image source: https://t.co/ES3RwshHs5

Tweets: https://t.co/gNhNLOc5wB / https://t.co/m3o46KTH21
Great Barrington Declaration debunked: https://t.co/gP8fxSAvH2...

Tweets: https://t.co/gNhNLOc5wB / https://t.co/DXJ3QzRj8G
h/t: @greg_travis: https://t.co/sfCKavwCbG ---

Ivor really says that: https://t.co/SAQIrgD6t3
Tweet: https://t.co/cduViTcs3b
@DrDomPimenta debunking Ivor:
https://t.co/zohU0S4aFz,
https://t.co/Ate8UMOVqG ...

https://t.co/HNlZ2o7VFR
https://t.co/GkDOY5PgX9
& as above.
More from Finance


Two year back thread on MFI, someone liked this so came up in notifications . Rather than running around 100s of indicators, I have made this my go to indicator under any circumstances and have been using this for years
This thread actually had some great answers , one can learn a lot about the thought processes of different traders from the answers. Please go thru them
What do you think/use as the most robust leading indicator if following technical analysis ? Please answer with reason , I will provide my answer after 2 hours
— Subhadip Nandy (@SubhadipNandy16) August 12, 2019
( At Delhi airport , bored as hell )
This thread actually had some great answers , one can learn a lot about the thought processes of different traders from the answers. Please go thru them

As the DeFi bull market continues, some brutally honest tips for new founders fundraising in crypto.
👇
1/ The discount you offer to strategic investors is both to account for the risk of an unlaunched product, but also as compensation for continued value add and support.
So make sure you know the investor will support you and not leave you on read once the docs are signed!
2/ Having someone on your cap table/ token allocation is as important as hiring.
You wouldn't hire someone just because they are influencers on Twitter- you do your reference checks and find evidence of value add from other companies the investor has invested in.
3/ Don't trust, verify.
Many investors will promise you the world when they're trying to get on your cap table.
Talk to founders they backed to see how much of it is bullshit. Ask them about how the investor was there for them during hard times.
4/ Don't just go for "name brand" funds because you want the brand.
Sure, it's great validation, but optimize for fit, not vanity.
However, I do think many well-known VCs are good actors, especially those with roots in successful trad VCs. They have a rep for a reason!
👇
Equity/ownership is a force. Getting it in the hands of the right people generously will drive alignment and execution.
— Joey Santoro (@Joey__Santoro) January 21, 2021
It is a joyful and serious responsibility \U0001f332
1/ The discount you offer to strategic investors is both to account for the risk of an unlaunched product, but also as compensation for continued value add and support.
So make sure you know the investor will support you and not leave you on read once the docs are signed!
2/ Having someone on your cap table/ token allocation is as important as hiring.
You wouldn't hire someone just because they are influencers on Twitter- you do your reference checks and find evidence of value add from other companies the investor has invested in.
3/ Don't trust, verify.
Many investors will promise you the world when they're trying to get on your cap table.
Talk to founders they backed to see how much of it is bullshit. Ask them about how the investor was there for them during hard times.
4/ Don't just go for "name brand" funds because you want the brand.
Sure, it's great validation, but optimize for fit, not vanity.
However, I do think many well-known VCs are good actors, especially those with roots in successful trad VCs. They have a rep for a reason!


You May Also Like


THREAD: 12 Things Everyone Should Know About IQ
1. IQ is one of the most heritable psychological traits – that is, individual differences in IQ are strongly associated with individual differences in genes (at least in fairly typical modern environments). https://t.co/3XxzW9bxLE
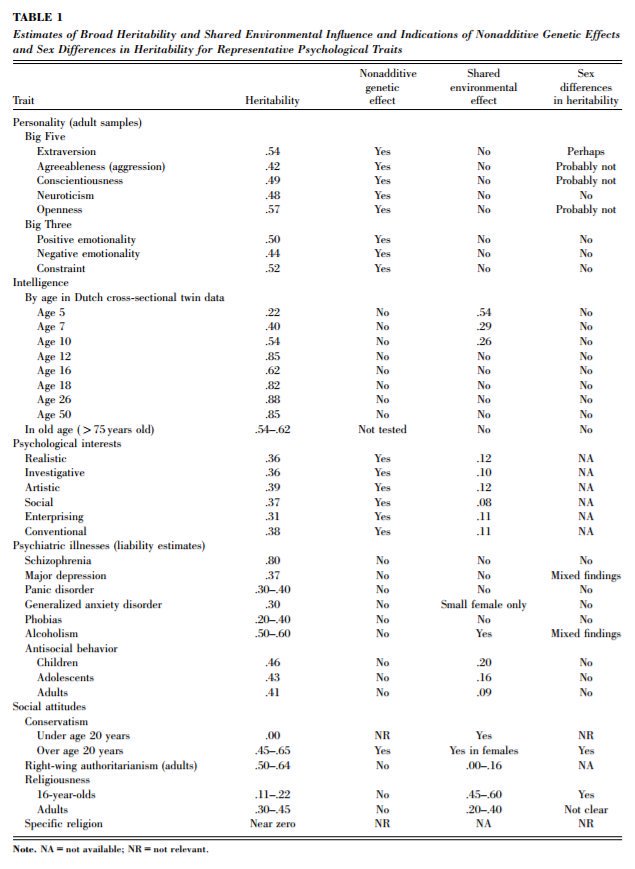
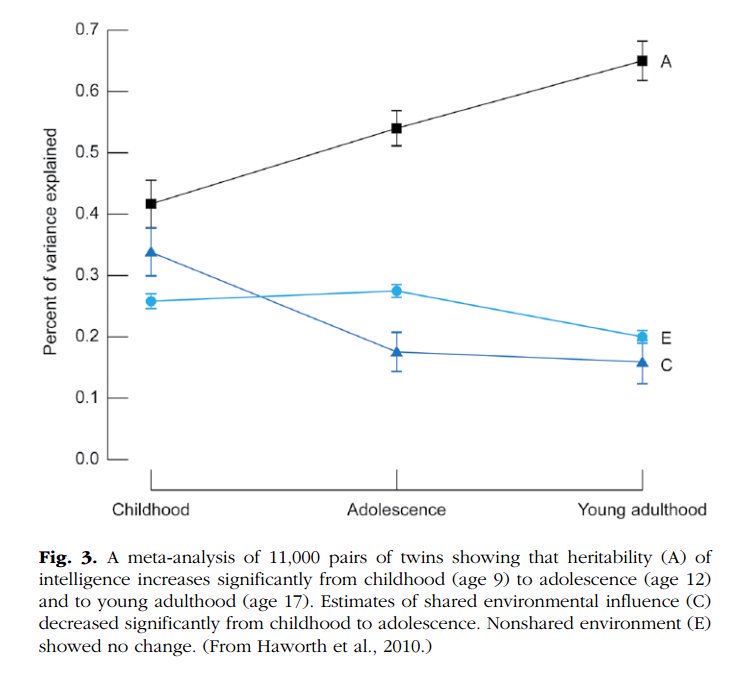
2. The heritability of IQ *increases* from childhood to adulthood. Meanwhile, the effect of the shared environment largely fades away. In other words, when it comes to IQ, nature becomes more important as we get older, nurture less. https://t.co/UqtS1lpw3n
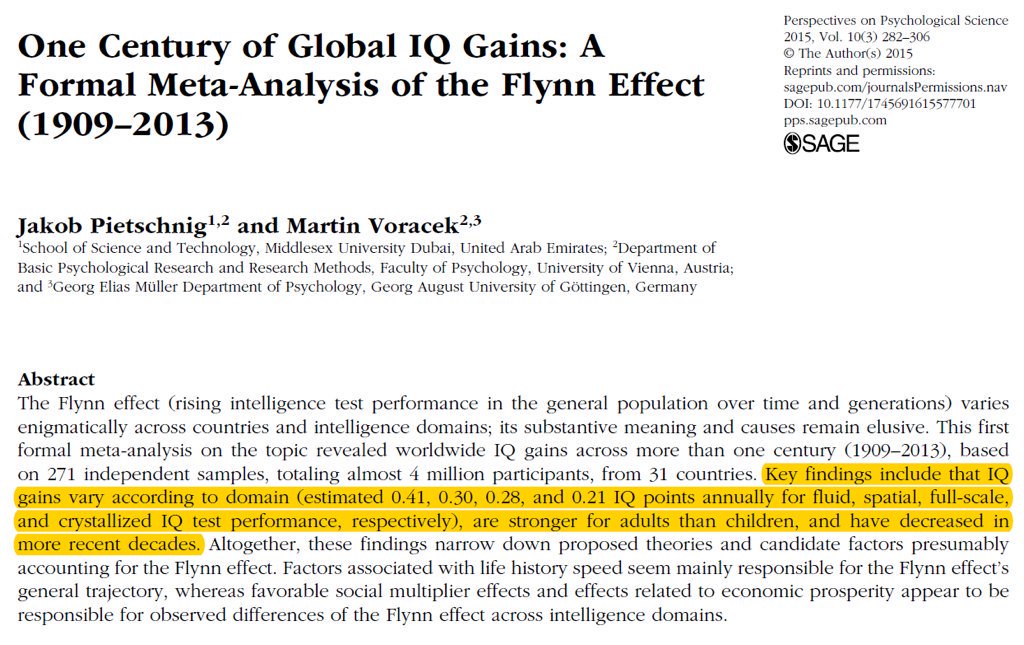
3. IQ scores have been increasing for the last century or so, a phenomenon known as the Flynn effect. https://t.co/sCZvCst3hw (N ≈ 4 million)
(Note that the Flynn effect shows that IQ isn't 100% genetic; it doesn't show that it's 100% environmental.)
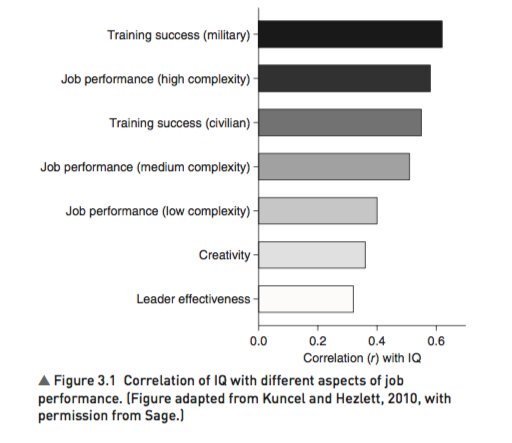
4. IQ predicts many important real world outcomes.
For example, though far from perfect, IQ is the single-best predictor of job performance we have – much better than Emotional Intelligence, the Big Five, Grit, etc. https://t.co/rKUgKDAAVx https://t.co/DWbVI8QSU3
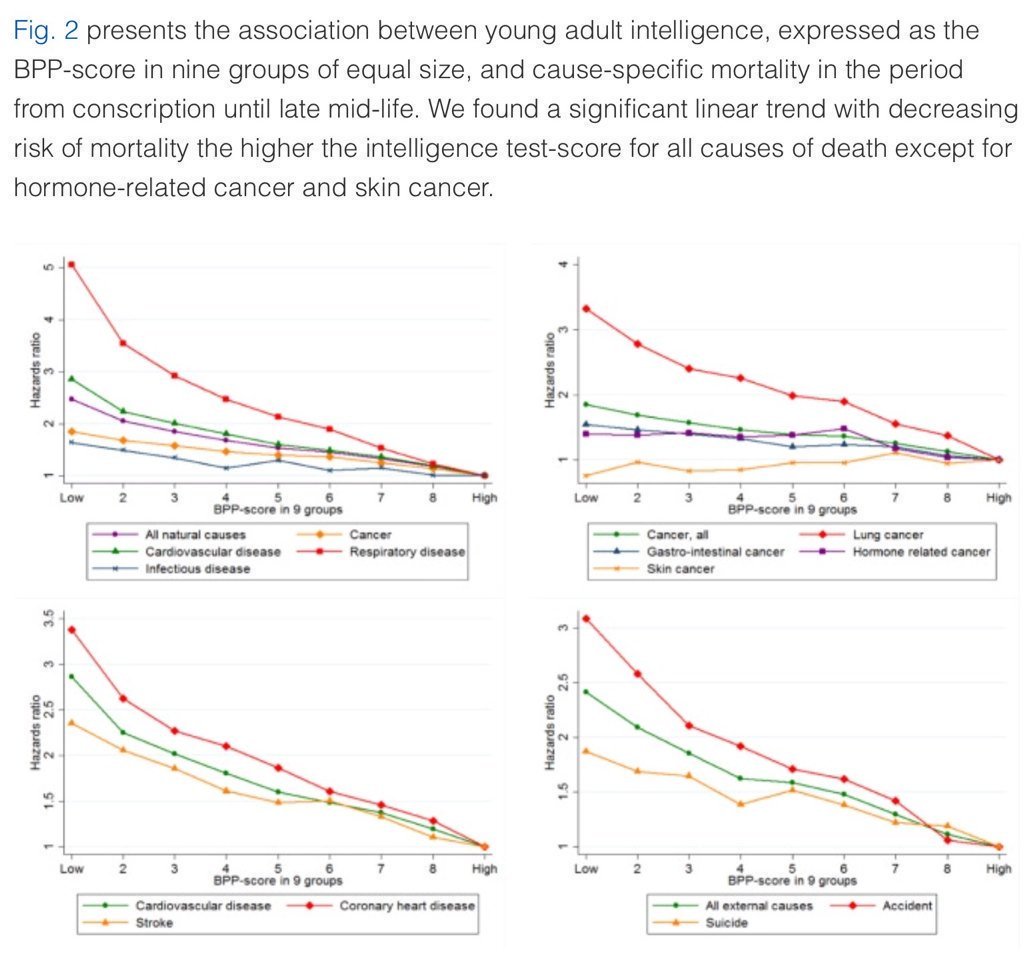
5. Higher IQ is associated with a lower risk of death from most causes, including cardiovascular disease, respiratory disease, most forms of cancer, homicide, suicide, and accident. https://t.co/PJjGNyeQRA (N = 728,160)
1. IQ is one of the most heritable psychological traits – that is, individual differences in IQ are strongly associated with individual differences in genes (at least in fairly typical modern environments). https://t.co/3XxzW9bxLE
2. The heritability of IQ *increases* from childhood to adulthood. Meanwhile, the effect of the shared environment largely fades away. In other words, when it comes to IQ, nature becomes more important as we get older, nurture less. https://t.co/UqtS1lpw3n
3. IQ scores have been increasing for the last century or so, a phenomenon known as the Flynn effect. https://t.co/sCZvCst3hw (N ≈ 4 million)
(Note that the Flynn effect shows that IQ isn't 100% genetic; it doesn't show that it's 100% environmental.)
4. IQ predicts many important real world outcomes.
For example, though far from perfect, IQ is the single-best predictor of job performance we have – much better than Emotional Intelligence, the Big Five, Grit, etc. https://t.co/rKUgKDAAVx https://t.co/DWbVI8QSU3
5. Higher IQ is associated with a lower risk of death from most causes, including cardiovascular disease, respiratory disease, most forms of cancer, homicide, suicide, and accident. https://t.co/PJjGNyeQRA (N = 728,160)