Screencaps are not from a public site, but underlying data given is real, public, and verifiable.
Originally posted Jan 5th - https://t.co/Vim3JlOtlZ
FULTON CO.
We're looking at "book votes." That is, people who are marked as having voted in the voter rolls. This is how Floyd County was detected - you had an excess of voters in the book vs. what was recorded on machines.

Screencaps are not from a public site, but underlying data given is real, public, and verifiable.
Fulton has 10K+ excess votes. This has been blamed on stale record keeping. At a precinct level, there are 14700 "excess" votes and 3900 "missing" votes.


This is a map of where the lowest vote increases relative to 2016 are. In other words, these are areas that simply didn't have much vote growth vs. 2016 (possibly didn't grow much in population).


The south cluster is 95%+ Black whereas the north cluster is 85%+ white. So, very different demographics.


We are asked to take @gasecofstate 's word that this is up-and-up with zero way of verifying it.
1) A centrally managed process of fraud (e.g., possibly as seen in the infamous suitcase video
If you find this compelling, please RT and spread far and wide.
More from Economy

1. HUGE DISCOVERY!
What would have been exposed if @GenFlynn hadn't been impeded by corrupt FBI, DOJ and the Obama White house?
He'd have exposed CHINA and their laundering of IRANIAN OIL MONEY!
Read the thread below for the back story on how they went after Flynn.
What would have been exposed if @GenFlynn hadn't been impeded by corrupt FBI, DOJ and the Obama White house?
He'd have exposed CHINA and their laundering of IRANIAN OIL MONEY!
Read the thread below for the back story on how they went after Flynn.
1. As promised.
— \U0001f1fa\U0001f1f8 \U0001d7dc\U0001d7d8\u210d\U0001d556\U0001d552\U0001d555 \U0001f1fa\U0001f1f8 \u2b50\u2b50\u2b50 \U0001f1fa\U0001f1f8 (@40_head) December 2, 2020
A deep dig covering years of research. This is going to take you committing some real time to get through. What's THIS all about?
A coup. Murder. Treason. Laundering gold for Iran...I think it will blow your mind.



One of the hardest problems post-pandemic will be how to revive so-called "left behind" places.
Post-industrial towns, run-down suburbs, coastal communities - these places were already struggling before the crisis and have fared worst in the last year.
What should we do?
Today, @ukonward sets out the beginning of a plan to repair our social fabric. It follows our extensive research over the last year, expertly chaired by @jamesosh, and funded by @jrf_uk, @Shelter and @peoplesbiz.
https://t.co/d3T5uPwG9N

Before I get into recommendations, some findings from previous Onward research.
In 2018, we found 71% of people believe "community has declined in my lifetime"
In 2019, we found 65% would rather live in “a society that focuses on giving people more security” vs 35% for freedom

This was the basis for our identification of 'Workington Man' as the archetypal swing voter in 2019, and led us to predict (correctly) that large numbers of Red Wall seats could fall. A key driver was a desire for security, belonging and pride in place.

There is also a key regional dimension to this. We also tested people's affinity with the UK's direction of travel, across both cultural and economic dimensions - revealing the extraordinary spread below: London vs. the Rest.
https://t.co/HrorW4xaLp

Post-industrial towns, run-down suburbs, coastal communities - these places were already struggling before the crisis and have fared worst in the last year.
What should we do?
Today, @ukonward sets out the beginning of a plan to repair our social fabric. It follows our extensive research over the last year, expertly chaired by @jamesosh, and funded by @jrf_uk, @Shelter and @peoplesbiz.
https://t.co/d3T5uPwG9N
Before I get into recommendations, some findings from previous Onward research.
In 2018, we found 71% of people believe "community has declined in my lifetime"
In 2019, we found 65% would rather live in “a society that focuses on giving people more security” vs 35% for freedom
This was the basis for our identification of 'Workington Man' as the archetypal swing voter in 2019, and led us to predict (correctly) that large numbers of Red Wall seats could fall. A key driver was a desire for security, belonging and pride in place.
There is also a key regional dimension to this. We also tested people's affinity with the UK's direction of travel, across both cultural and economic dimensions - revealing the extraordinary spread below: London vs. the Rest.
https://t.co/HrorW4xaLp

You May Also Like


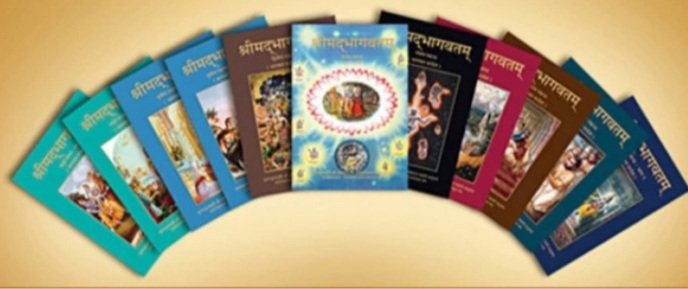
IMPORTANCE, ADVANTAGES AND CHARACTERISTICS OF BHAGWAT PURAN
It was Ved Vyas who edited the eighteen thousand shlokas of Bhagwat. This book destroys all your sins. It has twelve parts which are like kalpvraksh.
In the first skandh, the importance of Vedvyas
and characters of Pandavas are described by the dialogues between Suutji and Shaunakji. Then there is the story of Parikshit.
Next there is a Brahm Narad dialogue describing the avtaar of Bhagwan. Then the characteristics of Puraan are mentioned.
It also discusses the evolution of universe.( https://t.co/2aK1AZSC79 )
Next is the portrayal of Vidur and his dialogue with Maitreyji. Then there is a mention of Creation of universe by Brahma and the preachings of Sankhya by Kapil Muni.
In the next section we find the portrayal of Sati, Dhruv, Pruthu, and the story of ancient King, Bahirshi.
In the next section we find the character of King Priyavrat and his sons, different types of loks in this universe, and description of Narak. ( https://t.co/gmDTkLktKS )
In the sixth part we find the portrayal of Ajaamil ( https://t.co/LdVSSNspa2 ), Daksh and the birth of Marudgans( https://t.co/tecNidVckj )
In the seventh section we find the story of Prahlad and the description of Varnashram dharma. This section is based on karma vaasna.
It was Ved Vyas who edited the eighteen thousand shlokas of Bhagwat. This book destroys all your sins. It has twelve parts which are like kalpvraksh.
In the first skandh, the importance of Vedvyas
and characters of Pandavas are described by the dialogues between Suutji and Shaunakji. Then there is the story of Parikshit.
Next there is a Brahm Narad dialogue describing the avtaar of Bhagwan. Then the characteristics of Puraan are mentioned.
It also discusses the evolution of universe.( https://t.co/2aK1AZSC79 )
Next is the portrayal of Vidur and his dialogue with Maitreyji. Then there is a mention of Creation of universe by Brahma and the preachings of Sankhya by Kapil Muni.
HOW LIFE EVOLVED IN THIS UNIVERSE AS PER OUR SCRIPTURES.
— Anshul Pandey (@Anshulspiritual) August 29, 2020
Well maximum of Living being are the Vansaj of Rishi Kashyap. I have tried to give stories from different-different Puran. So lets start.... pic.twitter.com/MrrTS4xORk
In the next section we find the portrayal of Sati, Dhruv, Pruthu, and the story of ancient King, Bahirshi.
In the next section we find the character of King Priyavrat and his sons, different types of loks in this universe, and description of Narak. ( https://t.co/gmDTkLktKS )
Thread on NARK(HELL) / \u0928\u0930\u094d\u0915
— Anshul Pandey (@Anshulspiritual) August 11, 2020
Well today i will take you to a journey where nobody wants to go i.e Nark. Hence beware of doing Adharma/Evil things. There are various mentions in Puranas about Nark, But my Thread is only as per Bhagwat puran(SS attached in below Thread)
1/8 pic.twitter.com/raHYWtB53Q
In the sixth part we find the portrayal of Ajaamil ( https://t.co/LdVSSNspa2 ), Daksh and the birth of Marudgans( https://t.co/tecNidVckj )
In the seventh section we find the story of Prahlad and the description of Varnashram dharma. This section is based on karma vaasna.
#THREAD
— Anshul Pandey (@Anshulspiritual) August 12, 2020
WHY PARENTS CHOOSE RELIGIOUS OR PARAMATMA'S NAMES FOR THEIR CHILDREN AND WHICH ARE THE EASIEST WAY TO WASH AWAY YOUR SINS.
Yesterday I had described the types of Naraka's and the Sin or Adharma for a person to be there.
1/8 pic.twitter.com/XjPB2hfnUC

So the cryptocurrency industry has basically two products, one which is relatively benign and doesn't have product market fit, and one which is malignant and does. The industry has a weird superposition of understanding this fact and (strategically?) not understanding it.
The benign product is sovereign programmable money, which is historically a niche interest of folks with a relatively clustered set of beliefs about the state, the literary merit of Snow Crash, and the utility of gold to the modern economy.
This product has narrow appeal and, accordingly, is worth about as much as everything else on a 486 sitting in someone's basement is worth.
The other product is investment scams, which have approximately the best product market fit of anything produced by humans. In no age, in no country, in no city, at no level of sophistication do people consistently say "Actually I would prefer not to get money for nothing."
This product needs the exchanges like they need oxygen, because the value of it is directly tied to having payment rails to move real currency into the ecosystem and some jurisdictional and regulatory legerdemain to stay one step ahead of the banhammer.
If everyone was holding bitcoin on the old x86 in their parents basement, we would be finding a price bottom. The problem is the risk is all pooled at a few brokerages and a network of rotten exchanges with counter party risk that makes AIG circa 2008 look like a good credit.
— Greg Wester (@gwestr) November 25, 2018
The benign product is sovereign programmable money, which is historically a niche interest of folks with a relatively clustered set of beliefs about the state, the literary merit of Snow Crash, and the utility of gold to the modern economy.
This product has narrow appeal and, accordingly, is worth about as much as everything else on a 486 sitting in someone's basement is worth.
The other product is investment scams, which have approximately the best product market fit of anything produced by humans. In no age, in no country, in no city, at no level of sophistication do people consistently say "Actually I would prefer not to get money for nothing."
This product needs the exchanges like they need oxygen, because the value of it is directly tied to having payment rails to move real currency into the ecosystem and some jurisdictional and regulatory legerdemain to stay one step ahead of the banhammer.