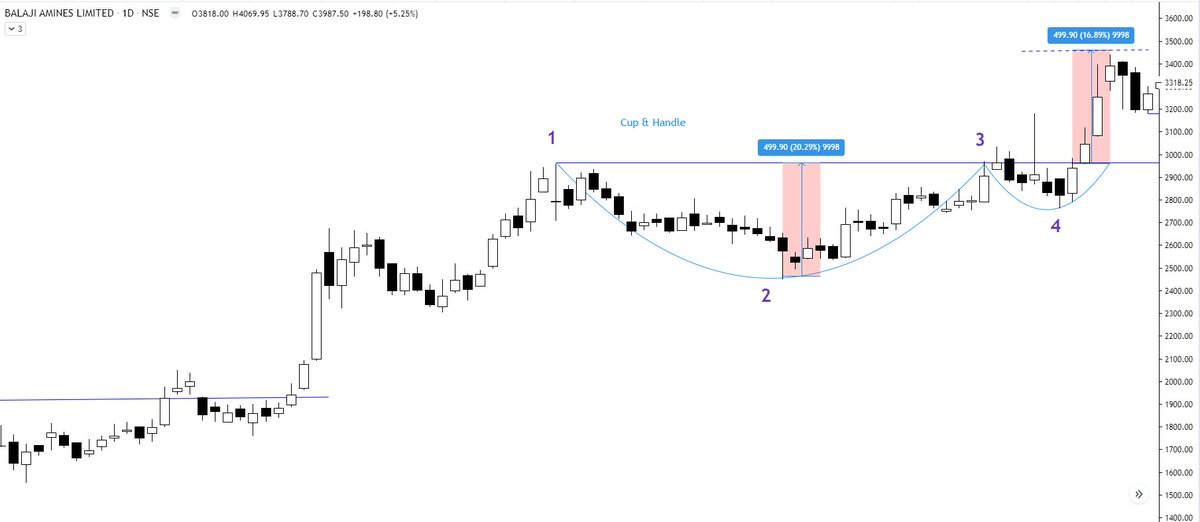
It moves back till point 3 which is now the psychological resistance level and would again see profit booking by weak hands.


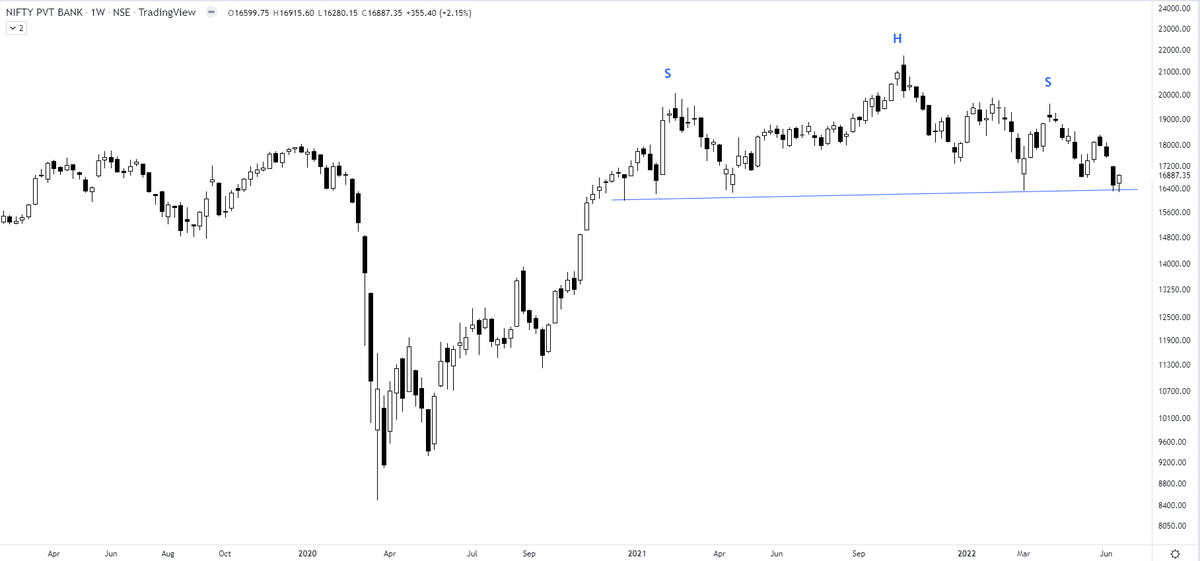
I am watching a big bearish H&S top building up in Nifty Private Bank Index. Any breakdown will result in increased volatility in respective charts. For traders - definitely not a spot to be in. The index has to move beyond 19900 to negate the pattern. pic.twitter.com/IGFeyNrtQV
— The_Chartist \U0001f4c8 (@charts_zone) June 19, 2022
HOW LIFE EVOLVED IN THIS UNIVERSE AS PER OUR SCRIPTURES.
— Anshul Pandey (@Anshulspiritual) August 29, 2020
Well maximum of Living being are the Vansaj of Rishi Kashyap. I have tried to give stories from different-different Puran. So lets start.... pic.twitter.com/MrrTS4xORk
Thread on NARK(HELL) / \u0928\u0930\u094d\u0915
— Anshul Pandey (@Anshulspiritual) August 11, 2020
Well today i will take you to a journey where nobody wants to go i.e Nark. Hence beware of doing Adharma/Evil things. There are various mentions in Puranas about Nark, But my Thread is only as per Bhagwat puran(SS attached in below Thread)
1/8 pic.twitter.com/raHYWtB53Q
#THREAD
— Anshul Pandey (@Anshulspiritual) August 12, 2020
WHY PARENTS CHOOSE RELIGIOUS OR PARAMATMA'S NAMES FOR THEIR CHILDREN AND WHICH ARE THE EASIEST WAY TO WASH AWAY YOUR SINS.
Yesterday I had described the types of Naraka's and the Sin or Adharma for a person to be there.
1/8 pic.twitter.com/XjPB2hfnUC