Bullish & Bearish Patterns 📈

More from Stock Market Scientist™
Here are the links of some important threads of TA 📊 for new learners to study 😇😇
1️⃣Moving Avg
https://t.co/xbORdUm2MH
2️⃣Fibonacci
https://t.co/QS2FveTuF7
3️⃣Ichimoku
https://t.co/pITLA6IL9m
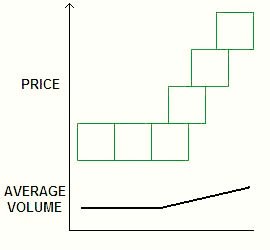
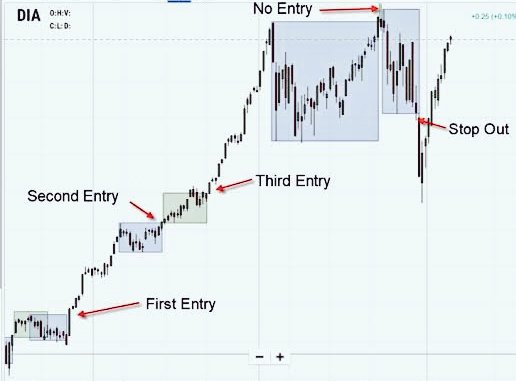
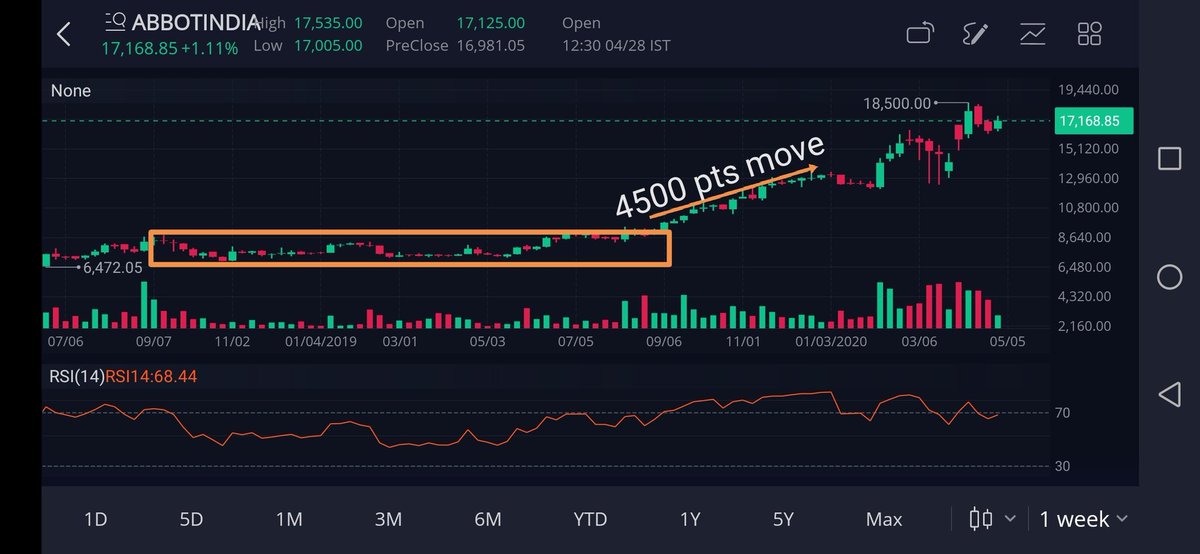
4️⃣Darvas Box Theory
https://t.co/PJ70uverV4
Happy Learning😇
Moving Averages Simplified\U0001f4d2
— Stock Market Scientist\u2122 (@MarketScientist) April 30, 2020
\U0001f535Its a technical indicator used by traders to identify trading opportunities
\U0001f535Its a Lagging indicator
\U0001f5352 MAs which traders use more often are..
SMA(Simple moving average) & EMA(Exponential moving average)
1/n#StockMarket #Technicals pic.twitter.com/ClDPEgVWZP
Here is the single point to access
all the threads of Price Patterns📈
1️⃣H&S Pattern
https://t.co/fmWhajgRFk
2️⃣C&H Pattern
https://t.co/6ZW977dCbr
3️⃣Flag Patterns
https://t.co/YUVRiLrVgI
4️⃣Wedge Patterns
https://t.co/6Lhka9dgyw
Happy Learning..!! 😇
H & S Pattern Simplified\U0001f4d2
— Stock Market Scientist\u2122 (@MarketScientist) May 25, 2020
Head & Shoulder Pattern\U0001f4ca
\U0001f535It is\xa0formed by a peak (shoulder), followed by a higher peak (head), & then another lower peak (shoulder)
\U0001f535A line called neckline\xa0is\xa0drawn by connecting the lowest points of the two troughs
1/n#StockMarket #Technicals pic.twitter.com/ElCKkli5h3
Here are the links to access all the threads of Price Patterns📈
1️⃣H&S Pattern
https://t.co/fmWhajgRFk
2️⃣C&H Pattern
https://t.co/6ZW977dCbr
3️⃣Flag Patterns
https://t.co/YUVRiLrVgI
4️⃣Wedge Patterns
https://t.co/6Lhka9dgyw
Happy Learning..!! 😇
H & S Pattern Simplified\U0001f4d2
— Stock Market Scientist\u2122 (@MarketScientist) May 25, 2020
Head & Shoulder Pattern\U0001f4ca
\U0001f535It is\xa0formed by a peak (shoulder), followed by a higher peak (head), & then another lower peak (shoulder)
\U0001f535A line called neckline\xa0is\xa0drawn by connecting the lowest points of the two troughs
1/n#StockMarket #Technicals pic.twitter.com/ElCKkli5h3
Here are the links of some important threads of TA 📊 to go through on holiday.
1️⃣Moving Avg
https://t.co/xbORdUm2MH
2️⃣Fibonacci
https://t.co/QS2FveTuF7
3️⃣Ichimoku
https://t.co/pITLA6IL9m
4️⃣Darvas Box Theory
https://t.co/PJ70uverV4
Happy Learning😇
Moving Averages Simplified\U0001f4d2
— Stock Market Scientist\u2122 (@MarketScientist) April 30, 2020
\U0001f535Its a technical indicator used by traders to identify trading opportunities
\U0001f535Its a Lagging indicator
\U0001f5352 MAs which traders use more often are..
SMA(Simple moving average) & EMA(Exponential moving average)
1/n#StockMarket #Technicals pic.twitter.com/ClDPEgVWZP
You May Also Like


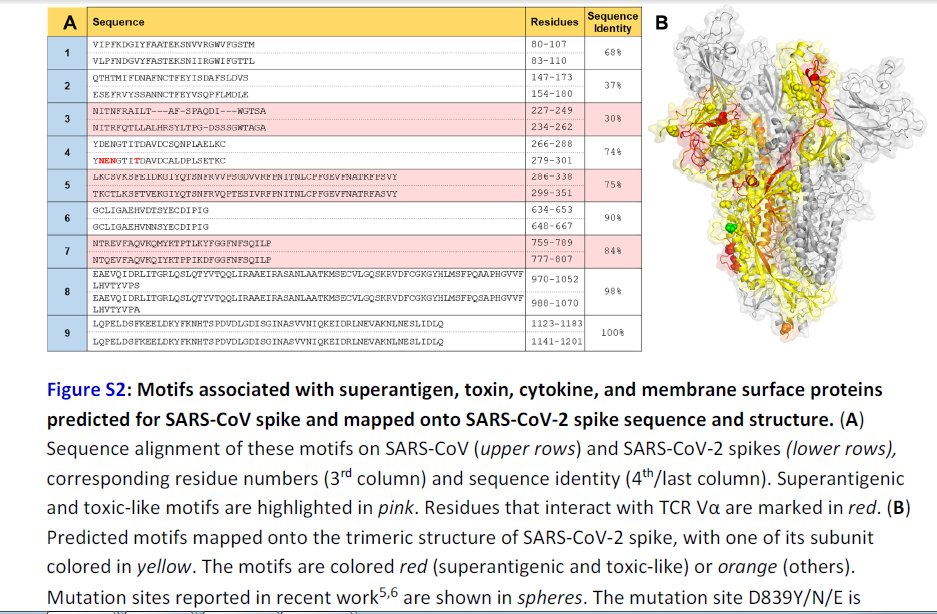
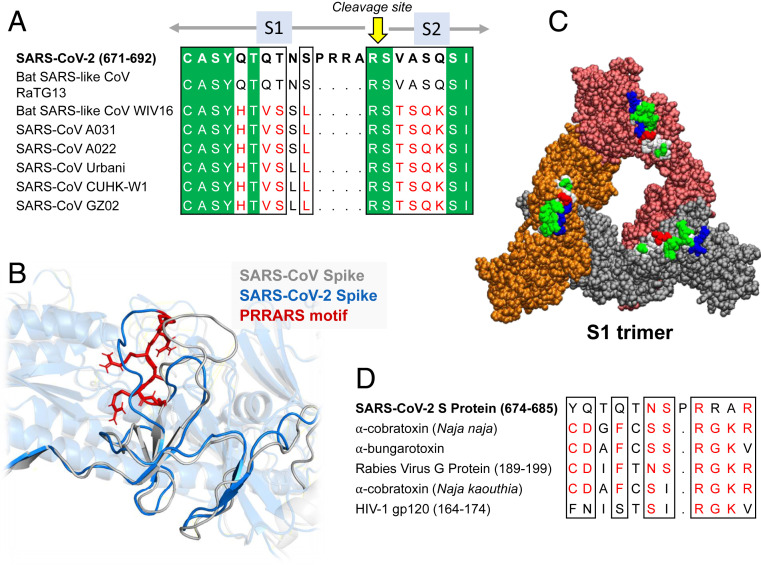
Further Examination of the Motif near PRRA Reveals Close Structural Similarity to the SEB Superantigen as well as Sequence Similarities to Neurotoxins and a Viral SAg.
The insertion PRRA together with 7 sequentially preceding residues & succeeding R685 (conserved in β-CoVs) form a motif, Y674QTQTNSPRRAR685, homologous to those of neurotoxins from Ophiophagus (cobra) and Bungarus genera, as well as neurotoxin-like regions from three RABV strains
(20) (Fig. 2D). We further noticed that the same segment bears close similarity to the HIV-1 glycoprotein gp120 SAg motif F164 to V174.
https://t.co/EwwJOSa8RK
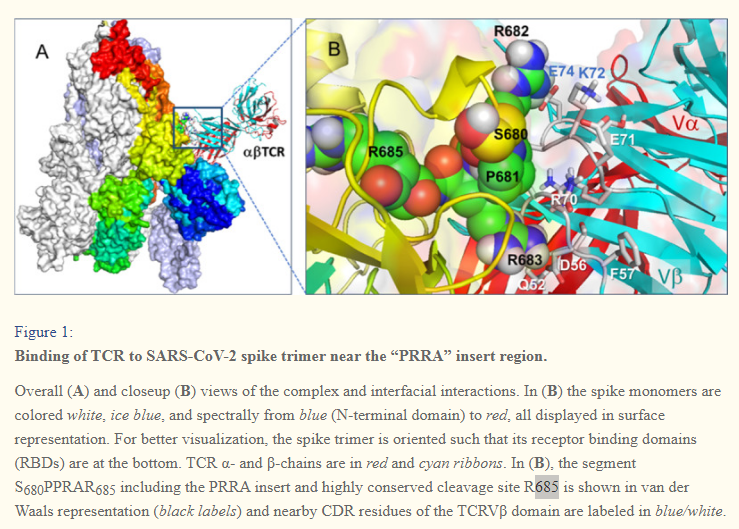
In (B), the segment S680PPRAR685 including the PRRA insert and highly conserved cleavage site *R685* is shown in van der Waals representation (black labels) and nearby CDR residues of the TCRVβ domain are labeled in blue/white
https://t.co/BsY8BAIzDa
Sequence Identity %
https://t.co/BsY8BAIzDa
Y674 - QTQTNSPRRA - R685
Similar to neurotoxins from Ophiophagus (cobra) & Bungarus genera & neurotoxin-like regions from three RABV strains
T678 - NSPRRA- R685
Superantigenic core, consistently aligned against bacterial or viral SAgs