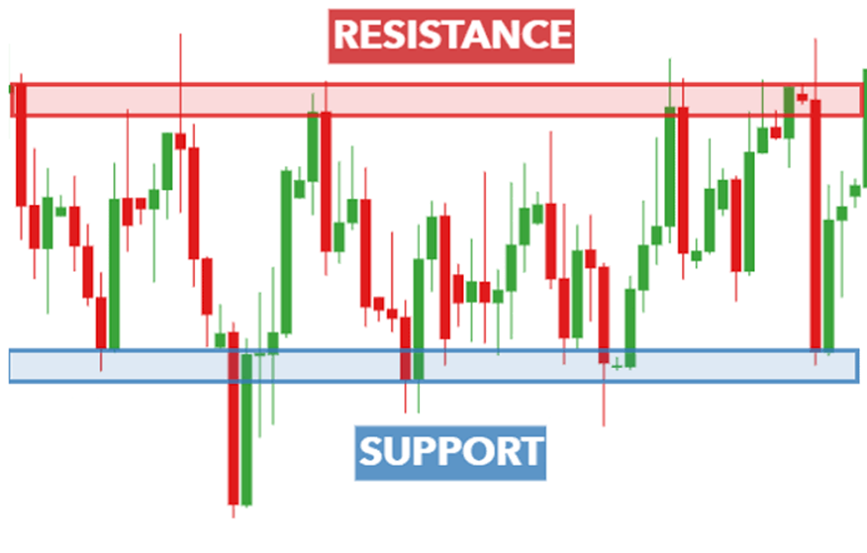
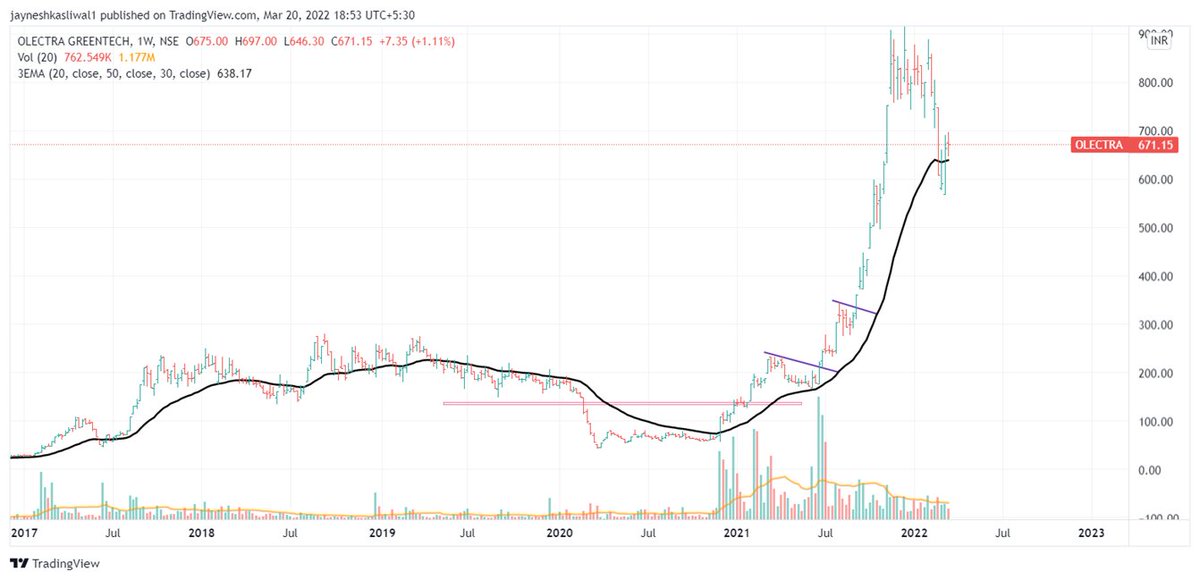
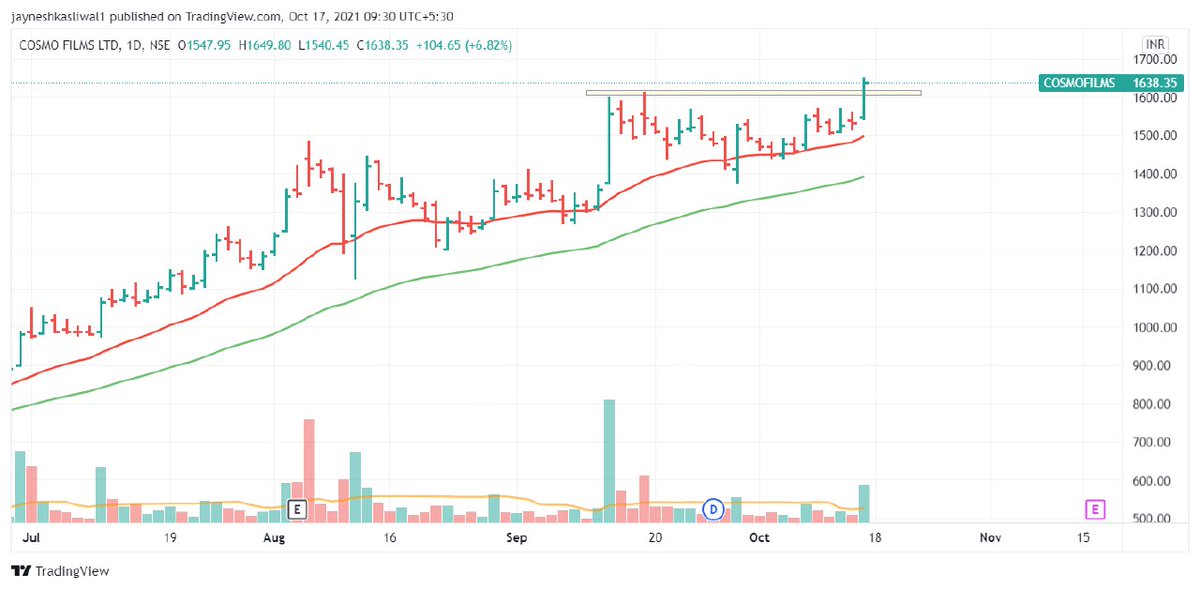
⏫Support is an area for price , where it halts due to demand of the stock at that price .
⏬Resistance is an area for price ,where it halts due to Supply of the stock at that price .
1/n


I have designed many beginner to advanced
— JayneshKasliwal (@JayneshKasliwal) September 24, 2022
Option Strategies free of cost
Here is a thread of all \U0001f9f5
A Retweet would help :)
There are many Trading Strategies but it takes only few to make money .
— JayneshKasliwal (@JayneshKasliwal) August 20, 2022
Here is a thread of all my Strategies \U0001f9f5


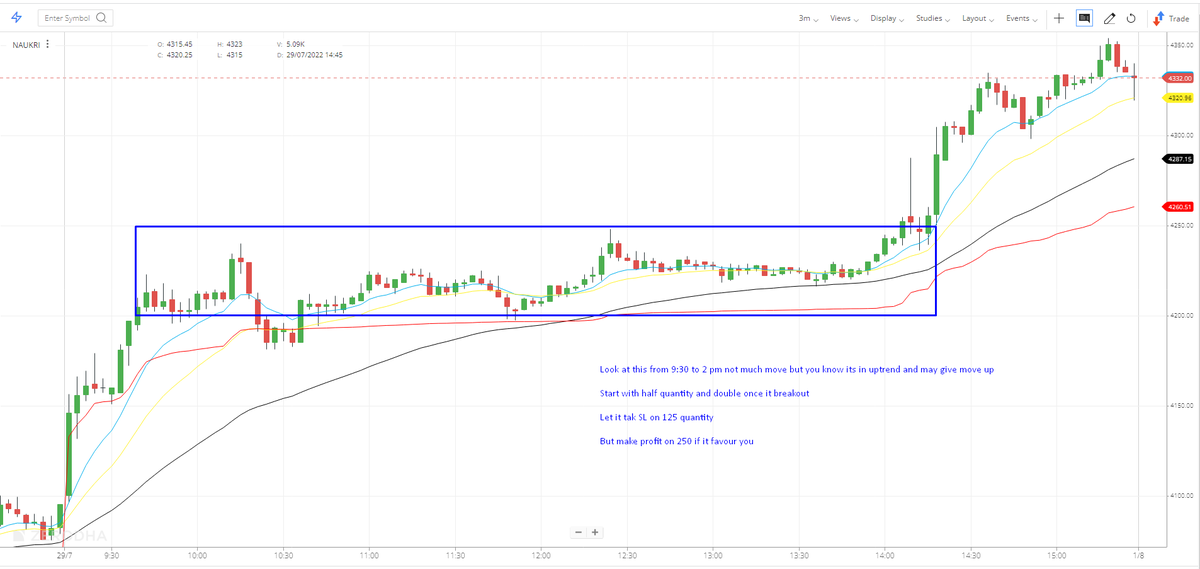
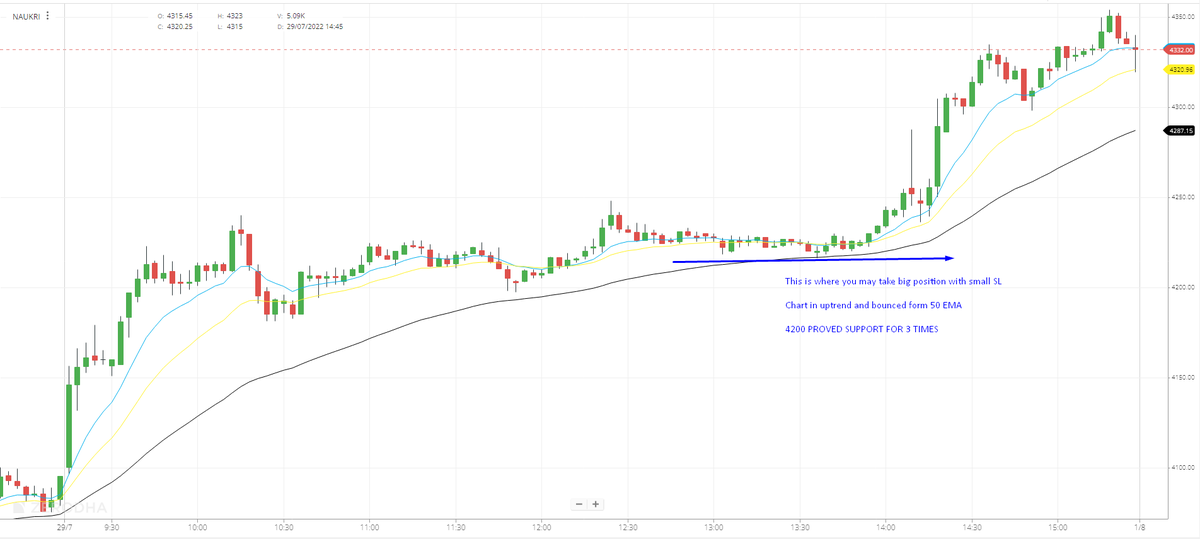
Time Frame importance -
— My First Stock (@myfirststock99) May 14, 2022
1) 3 min - For Execution
( indicators provide early signals and less reliable)
2) 15 min - to look at trend of week, Support and Resistance of last 4-5 days
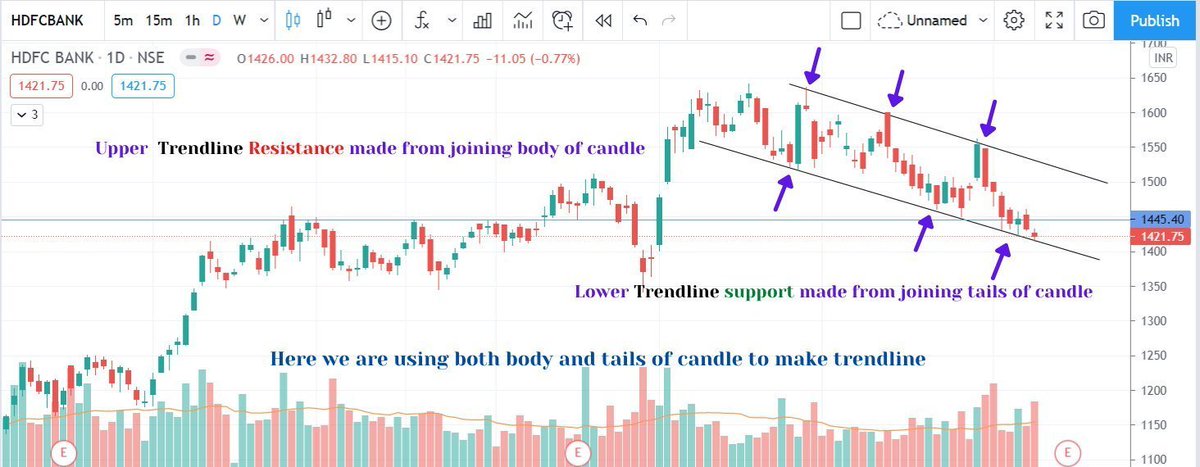
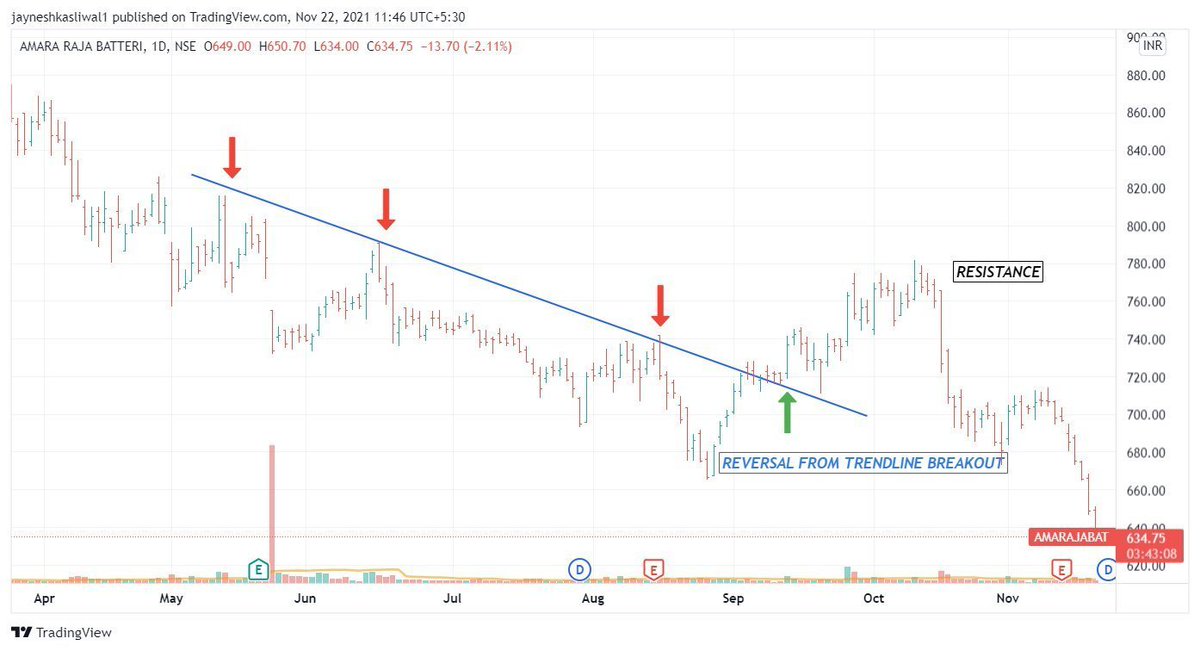
3) Daily - to check current trend and Short Term S-R (More reliability)
Charts - pic.twitter.com/SWHcQQ8m0F


![Peter McCormack [Jan/3\u279e\u20bf \U0001f511\u220e]](https://pbs.twimg.com/profile_images/1524287442307723265/_59ITDbJ_normal.jpg)