In this thread, we'll learn about -
1. Features
2. Method to draw
3. Uses
4. Two Specific setups
5. Five crucial Tips


Super thread on Trendlines & Two High-Quality Setups based on them.
— The Cnceptual Trader \U0001f1ee\U0001f1f3 (@CnceptualTrader) September 18, 2022
\U0001f9f5

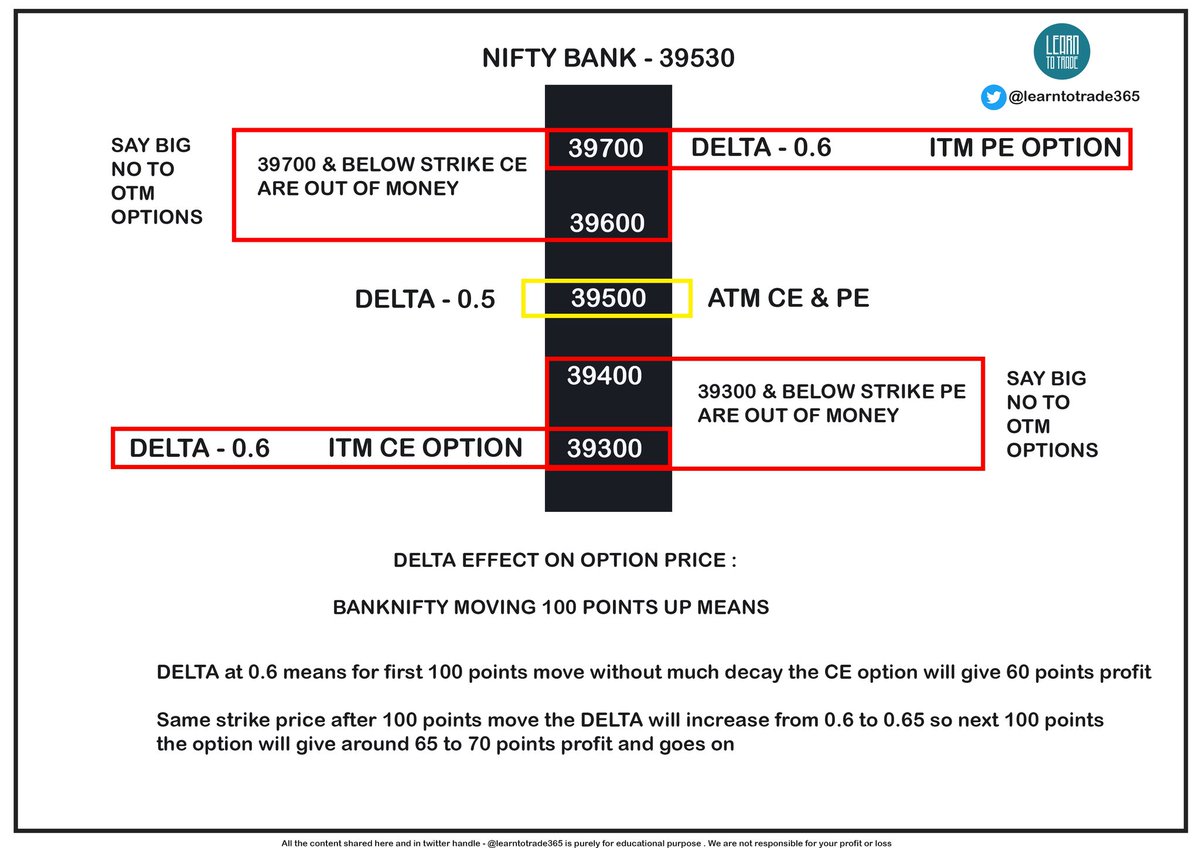
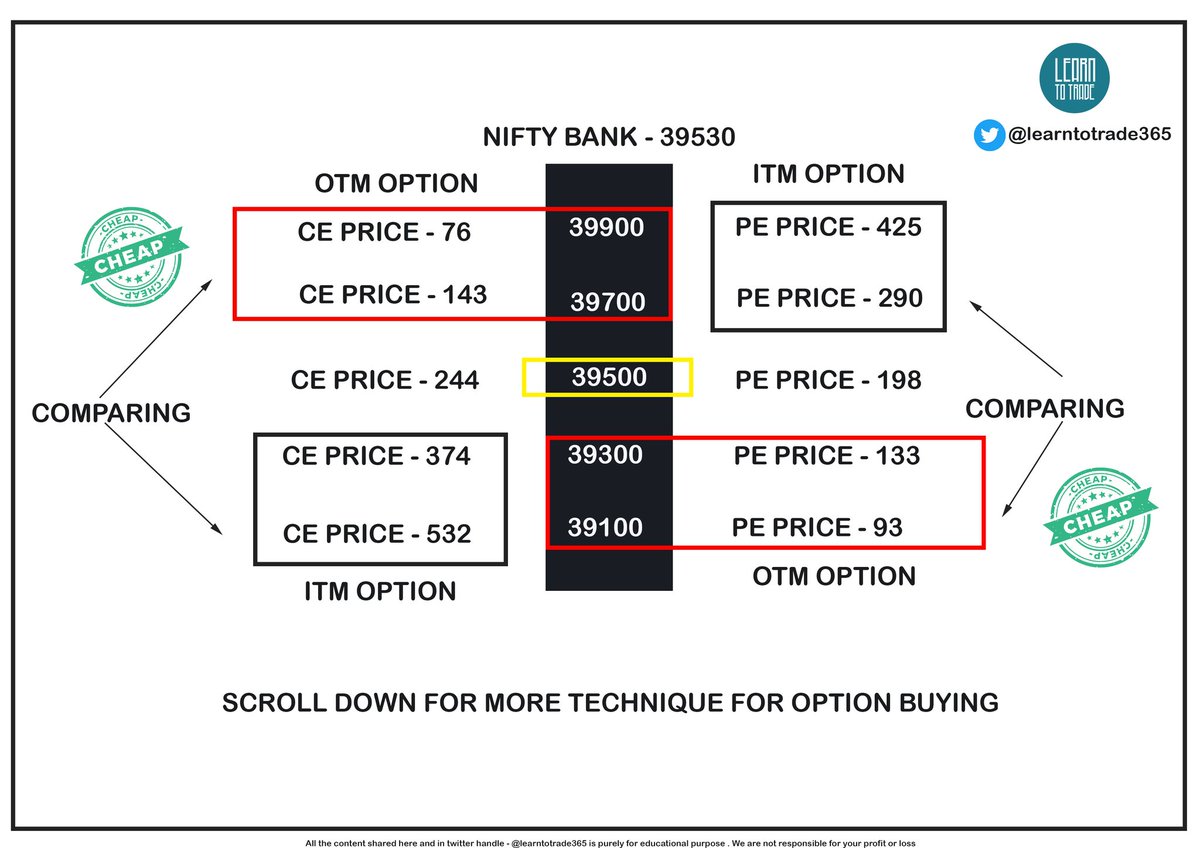
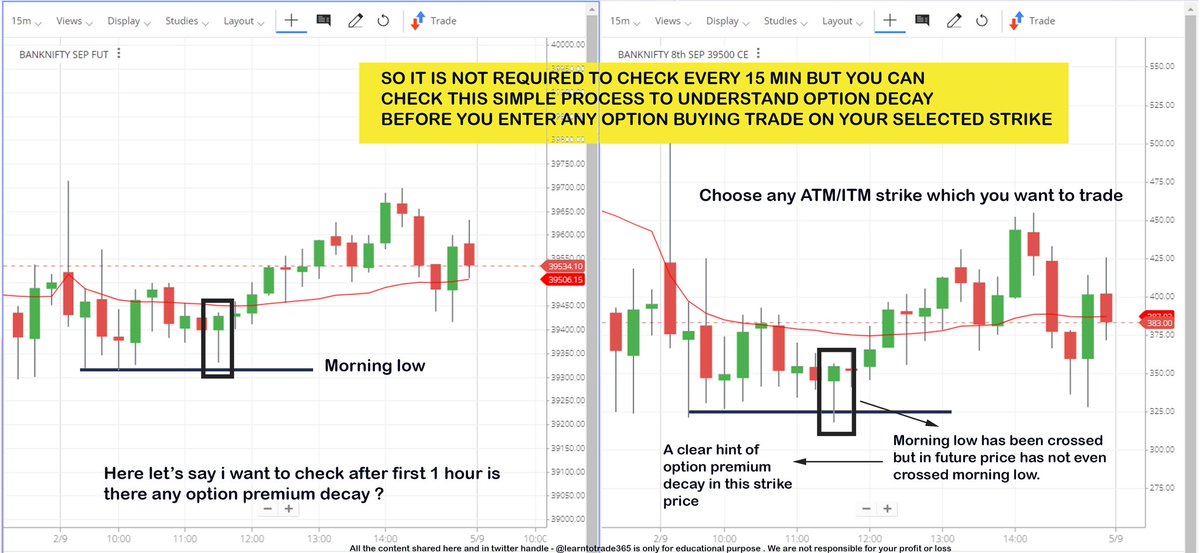
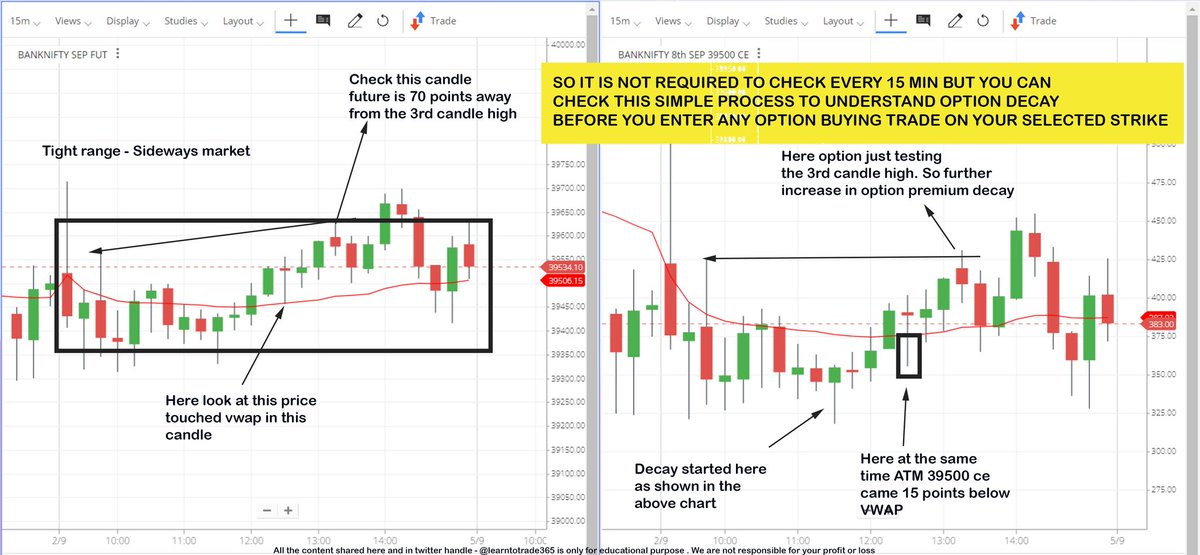
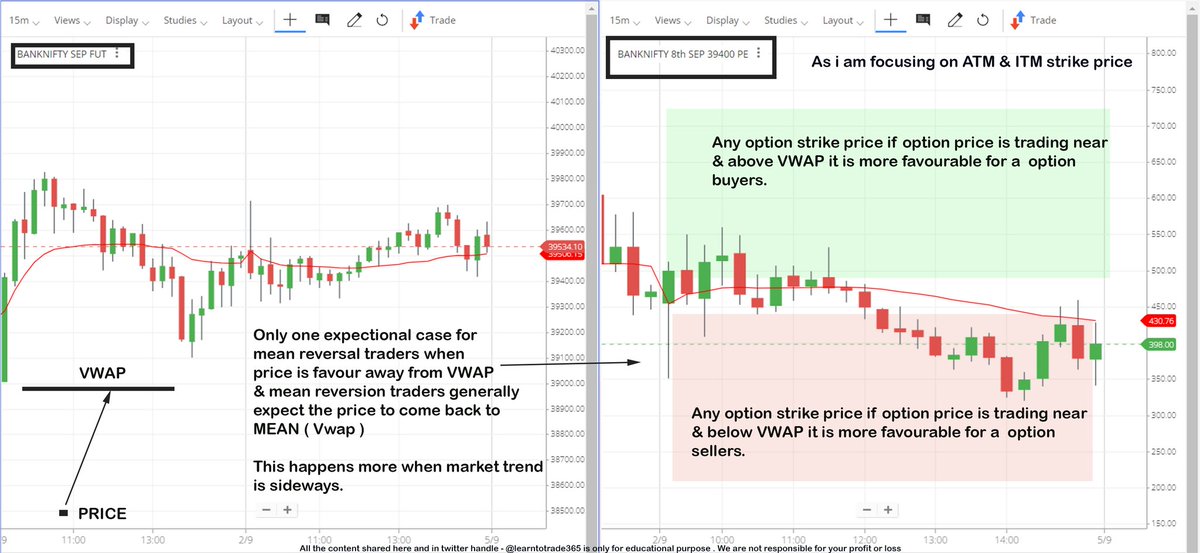
Option Buying Simplified
— Learn to Trade (@learntotrade365) August 31, 2022
Very important thread for all option buyers \U0001f9f5
Just 5 minutes to read but it can change your trading a lot.
Support us by RETWEET this tweet to help most option buyers to gain knowledge & to avoid getting trapped from big players pic.twitter.com/BaaTjJix7F
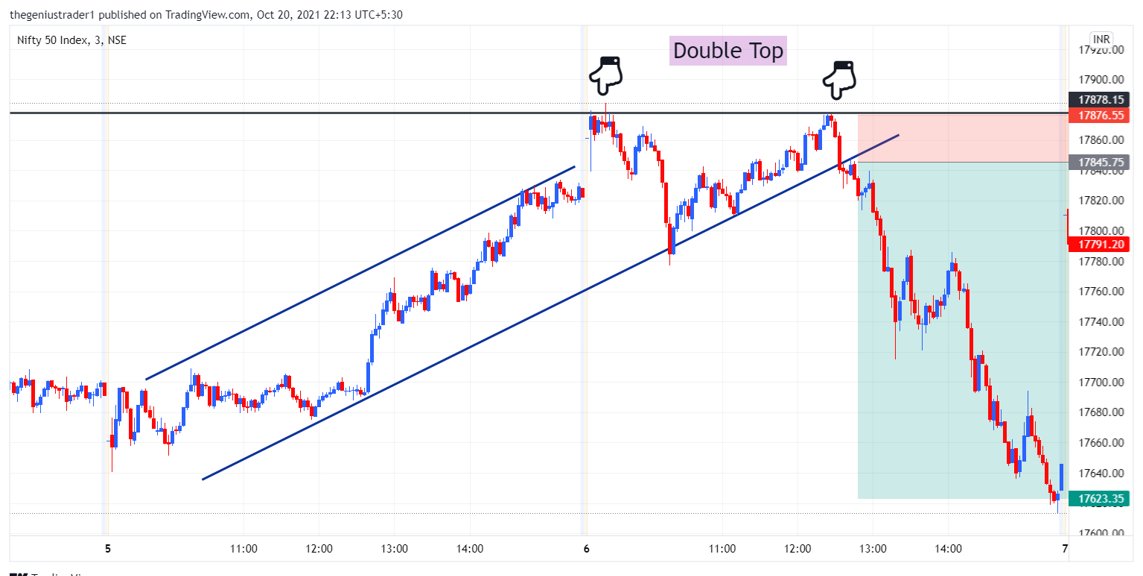
Price Action Trading ( Without Indicators)
— Learn to Trade (@learntotrade365) August 20, 2022
Intraday Trading strategy for all Directional traders.
Intraday Trading Strategy Thread \U0001f9f5
Support us by RETWEET to reach and benefit maximum traders
Scroll down \U0001f447 pic.twitter.com/AVsKmWroMc
Vwap with Pivot Points
— Learn to Trade (@learntotrade365) August 14, 2022
Intraday Trading strategy for Trend followers ( Will share also for mean reversion trader as soon as possible )
Intraday Trading Strategy Thread \U0001f9f5
Support us by Retweet to reach and benefit maximum traders
Scroll down \U0001f447 pic.twitter.com/xYPPnqWQ02
Buyers vs Sellers
— Learn to Trade (@learntotrade365) August 13, 2022
A simple technique to understand the index direction using candlesticks chart.
Intraday Trading Thread \U0001f9f5
Retweet to reach & benefit maximum traders
Scroll down \U0001f447 pic.twitter.com/6vMK92EqDo