Option Buying Simplified (PART -2)

Very important thread for all option buyers ๐Ÿงต

Just 5 to 10 minutes to read but it can change your trading a lot.

Support us by RETWEET this tweet to help more option buyers to gain knowledge & to avoid getting trapped from big players https://t.co/yBZ6Y7BaGx

I do Intraday Live Market session via Youtube Live on all trading days - Follow us on twitter @learntotrade365

Join the Telegram channel for Live Market updates and more free content.

Scroll down ๐Ÿ‘‡

https://t.co/VU0bCGjU7s
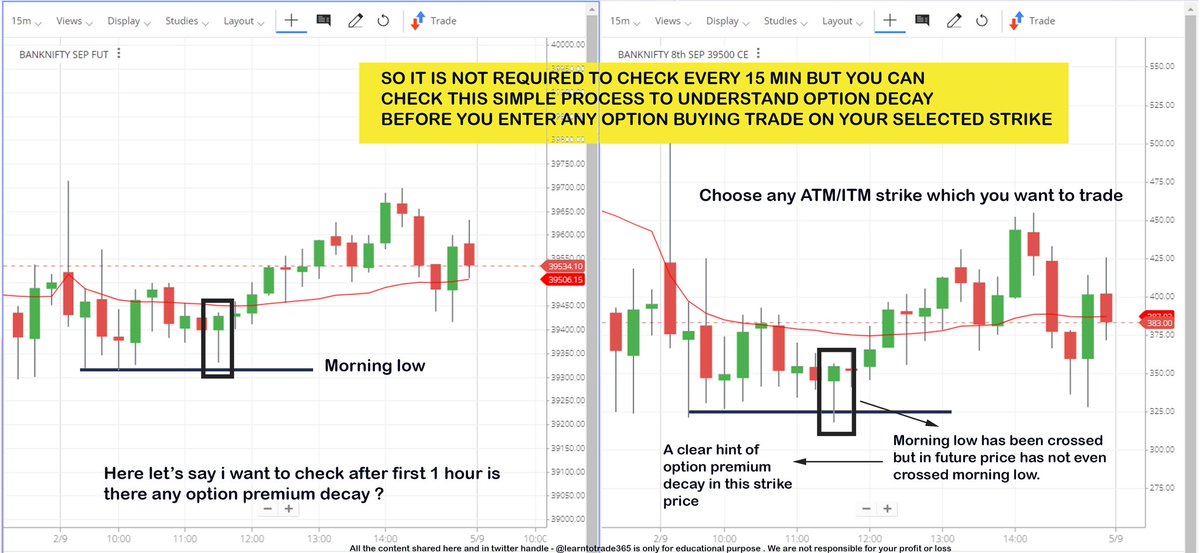
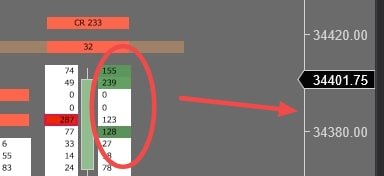
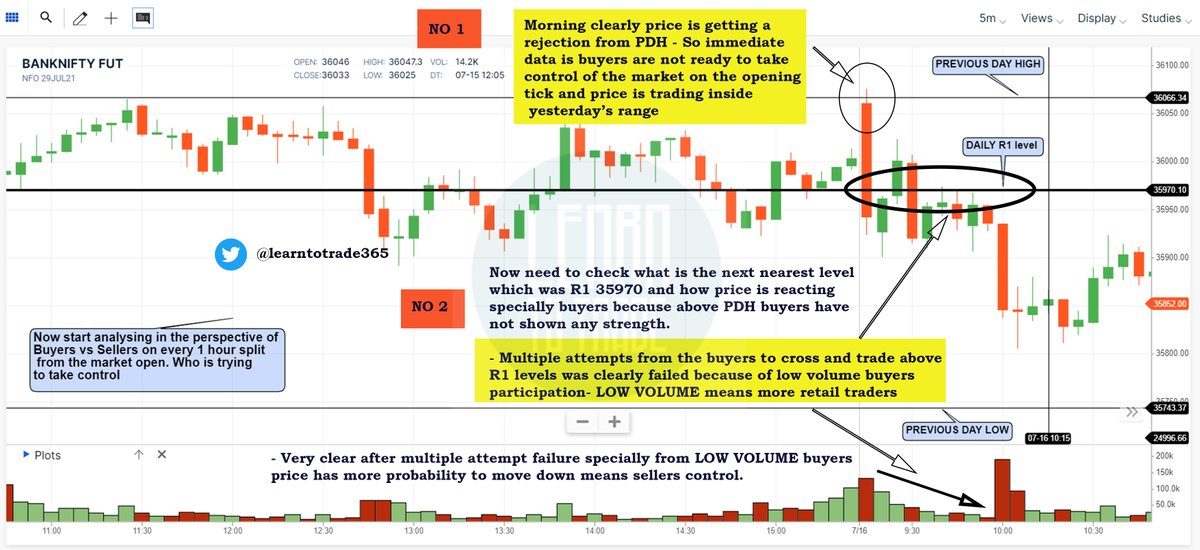
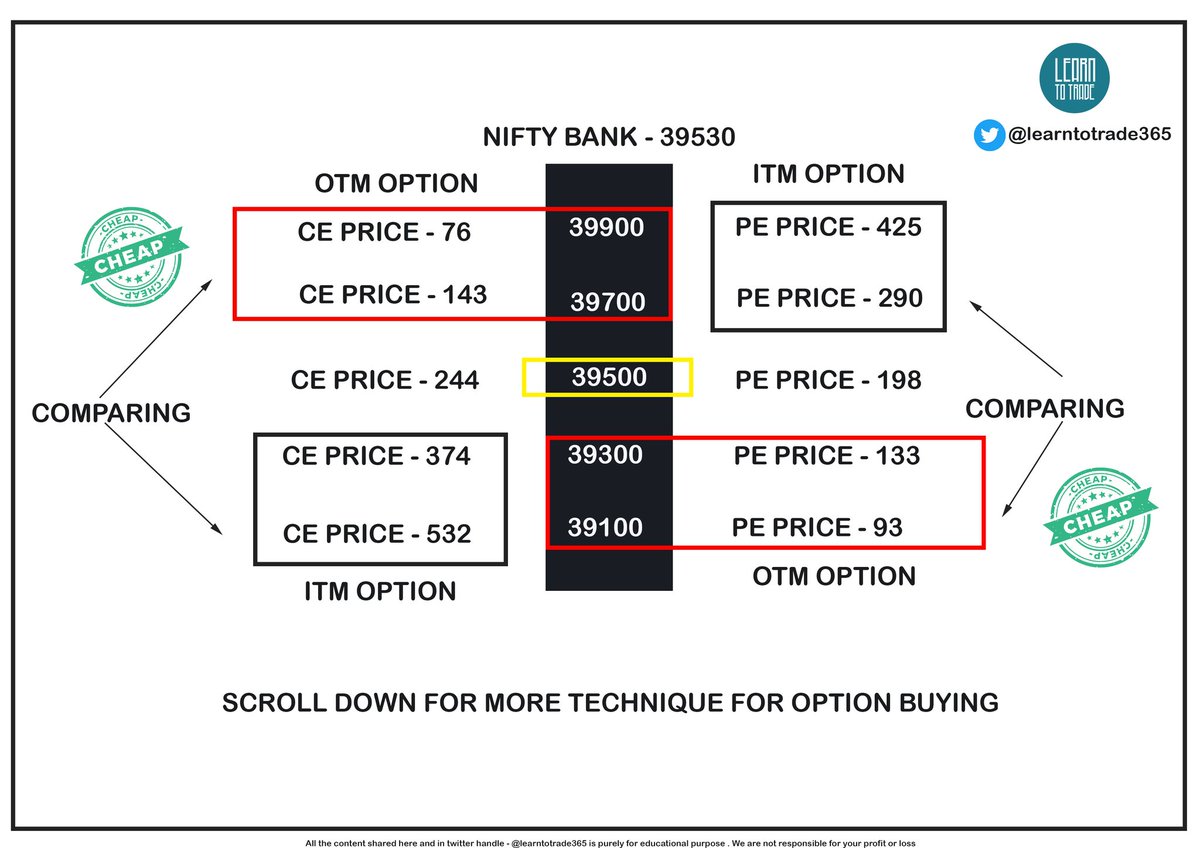
Main problem which most option buyers face is Option Premium erosion ( Theta Decay ). So I have shared a simple & effective process to understand the option decay during Live Market before entering option buying trades

Scroll down ๐Ÿ‘‡
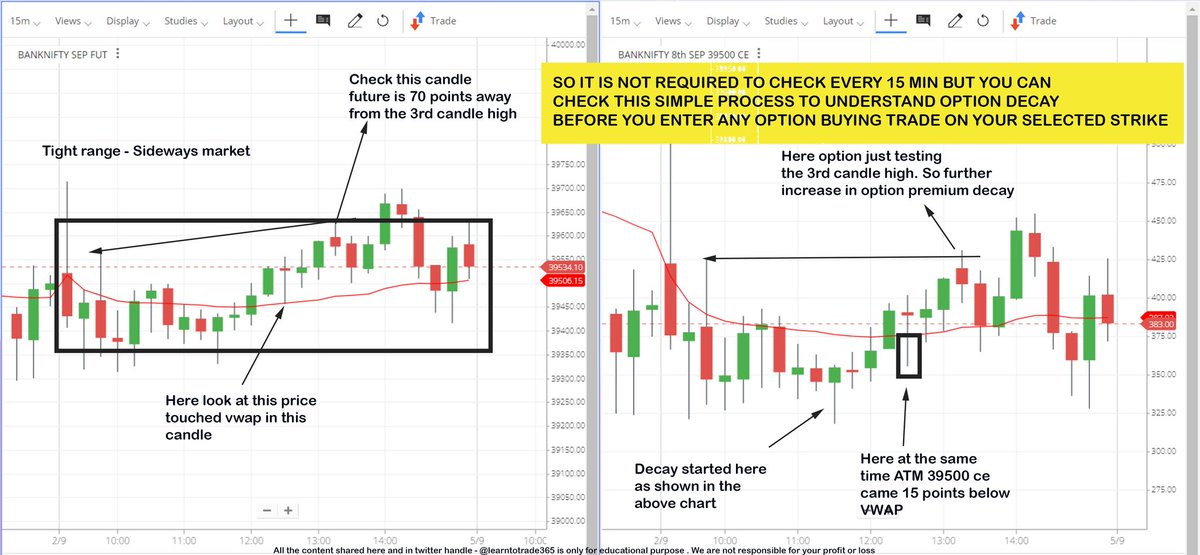
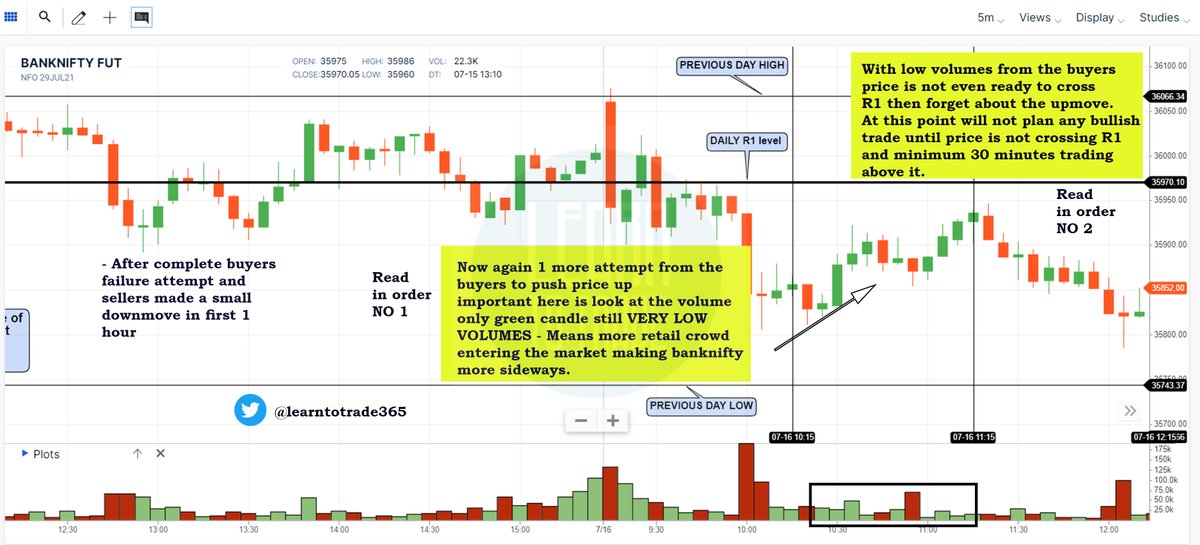
Follow up example from the above chart about Option premium decay during sideways market. In general most option premium erosion (theta decay) happens during sideways market.

Theta is option buyers ENEMY

Scroll down ๐Ÿ‘‡
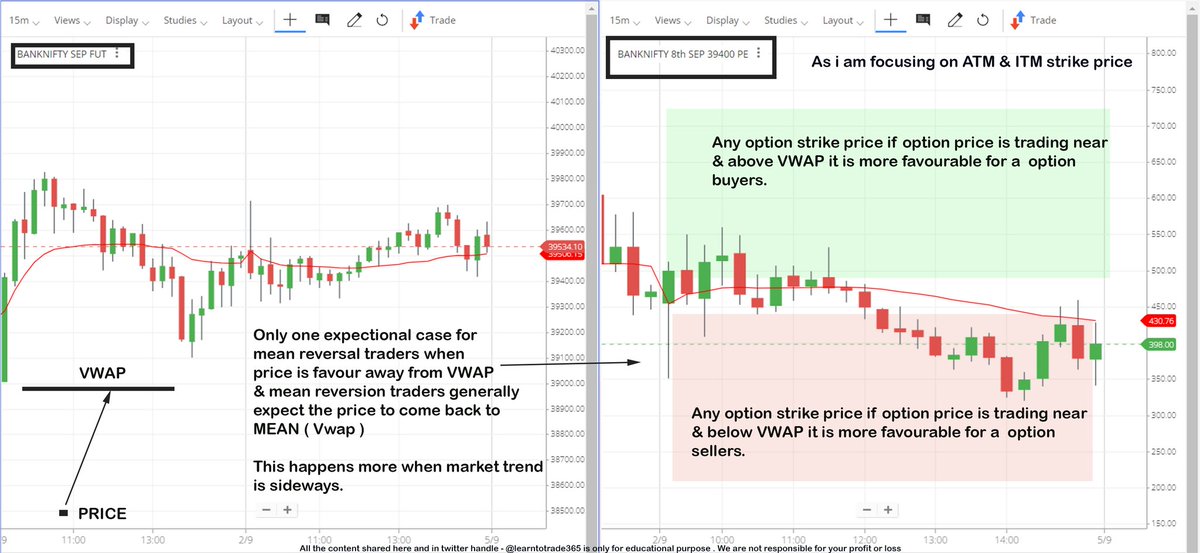
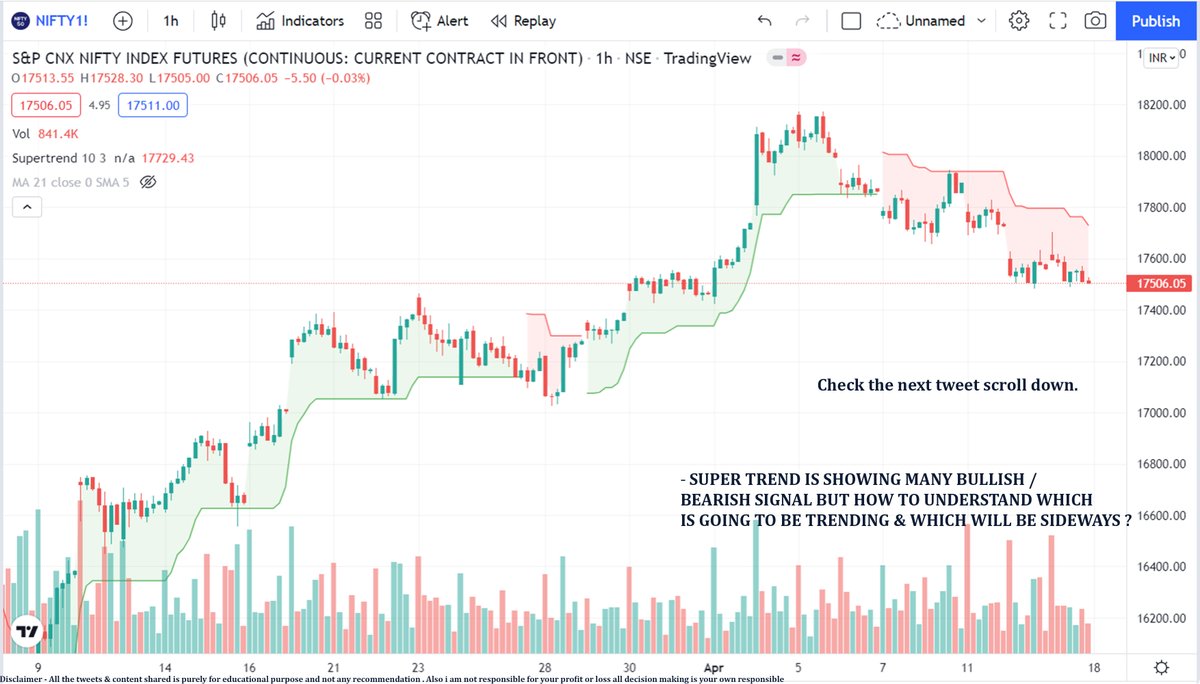
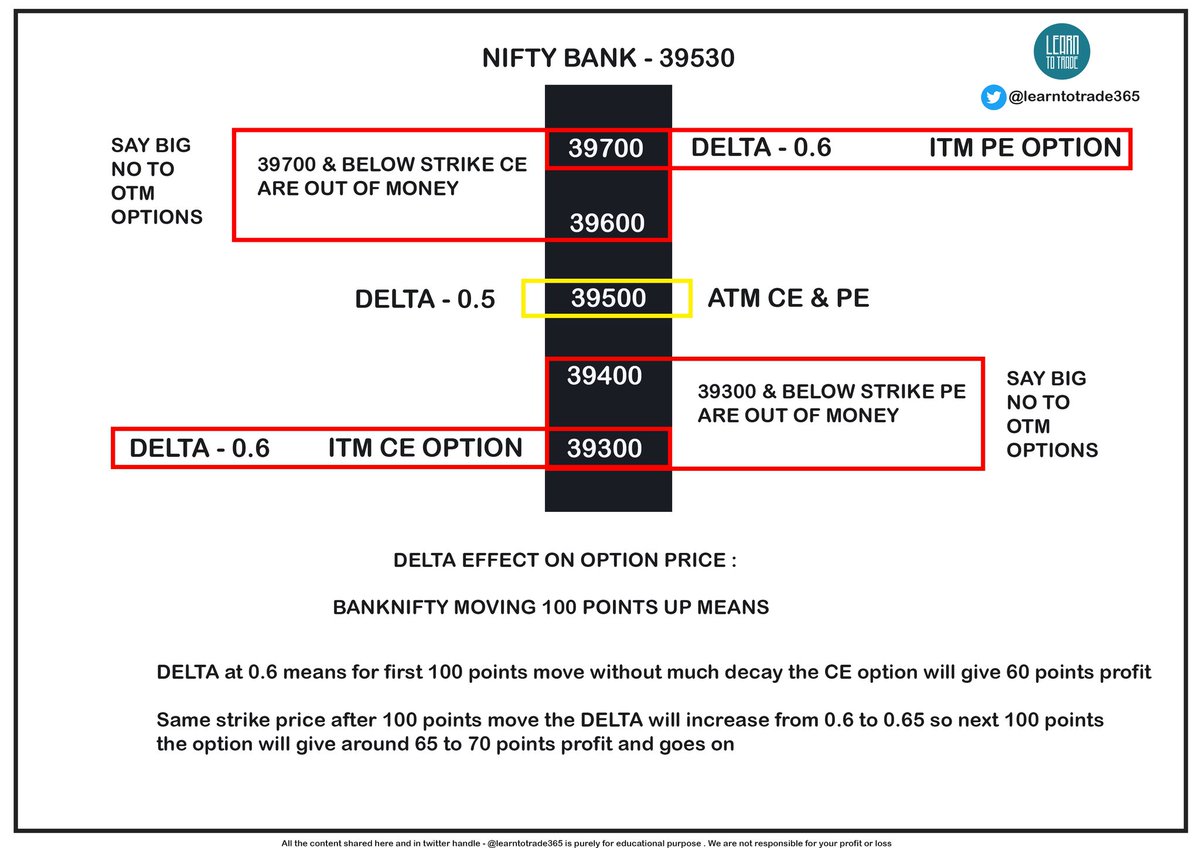
Option Buyers high probability zones while trading ATM & ITM strike prices.

VWAP helps a lot in providing data during Live Market

Scroll down ๐Ÿ‘‡
Option buyers want,

Direction
Momentum
Price should not spend more time on & around VWAP

If above confirmation is not there during Live Market wait for the opportunity. Make Trading as simple as possible.

Scroll down ๐Ÿ‘‡
Main work of a option buyer is to stay with the current market direction. When all clues from the chart is showing,

Bullish means focus more on CE
Bearish means focus more on PE

40% to 50% of your loss will be reduced by following the above steps

Scroll down ๐Ÿ‘‡
End of the thread

If you find the thread useful make sure to RETWEET & Like the first tweet. Your support is very important.

Follow us on twitter @learntotrade365 to get more trading content & strategies.

Also do check this MEGA Learning thread ๐Ÿ‘‡
https://t.co/1VnfNSBwKp

More from Learn to Trade

Highly effective Trading strategy which can help to follow the trend & ride the direction in BANKNIFTY ( Without Indicators)

For Option Buyers, Option Sellers & all Directional traders

Simple strategy help to make more profits

Retweet this thread ๐Ÿงต to reach many traders


I also do Intraday Live Market sessions on all Trading days ( Monday to Friday 09:00 a.m to 01:00 p.m) - Follow us @learntotrade365

Join the Telegram channel -
https://t.co/VU0bCGAX9s

Scroll down ๐Ÿ‘‡

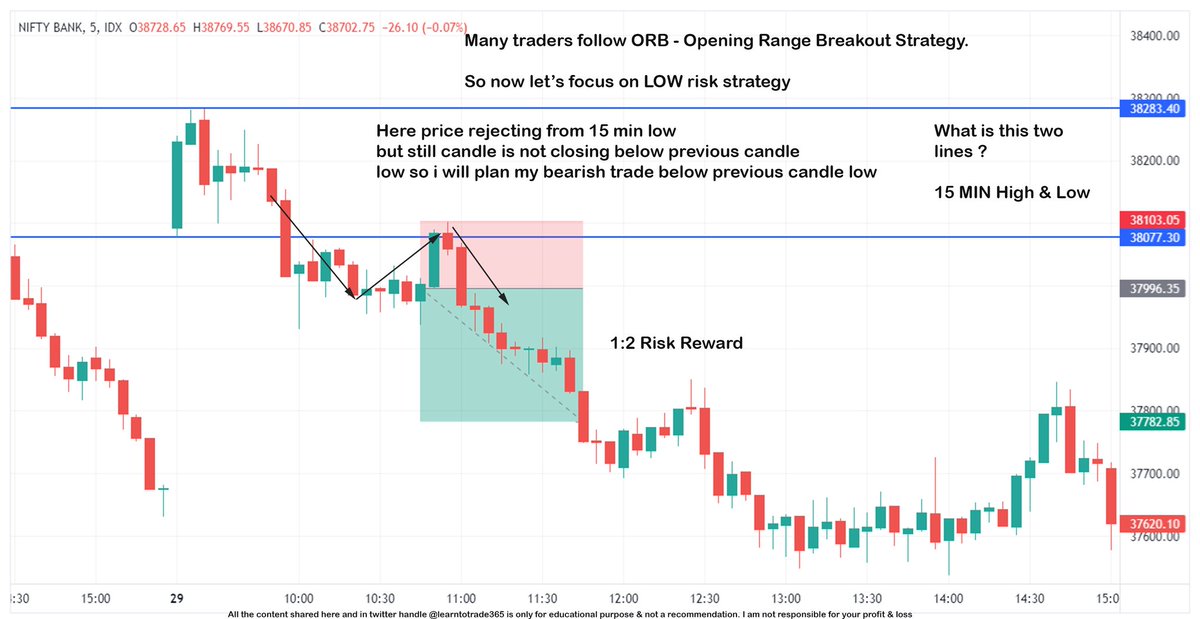
My approach here is to focus on Low risk High Reward strategy with simple 1st 15 Minutes High & Low. You can personally do your testing.

Chart 1 Scroll down ๐Ÿ‘‡


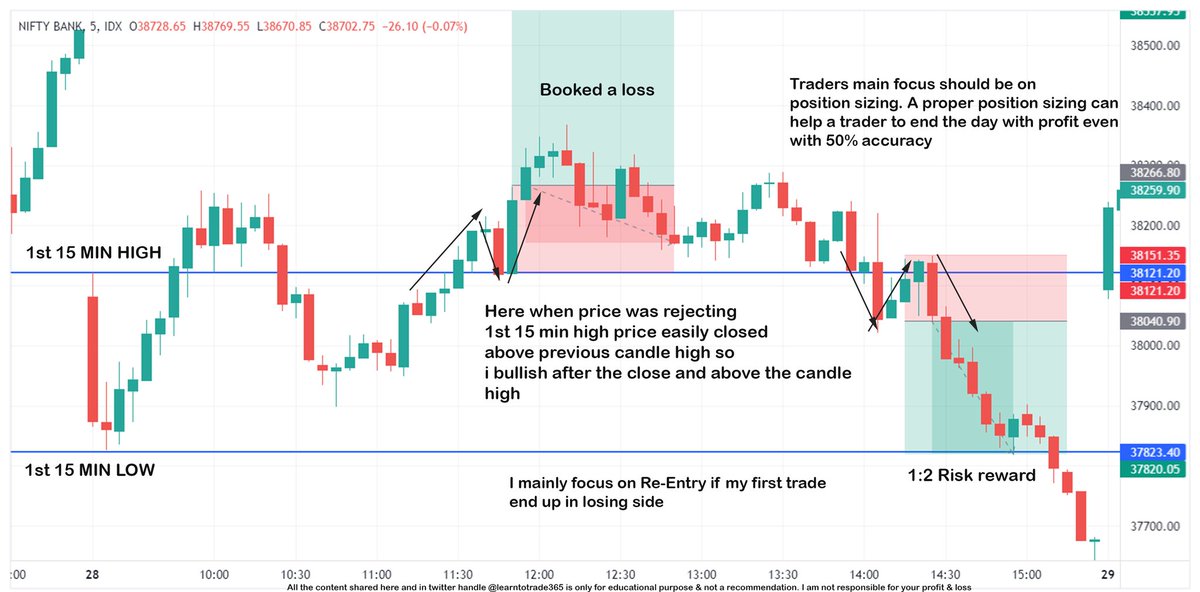
Trading involves both profit & loss. But still becoming a profitable traders is a skill of proper position sizing. Good position sizing is fix your losses and taking quantity according to the STOPLOSS

Chart -2 Scroll down๐Ÿ‘‡


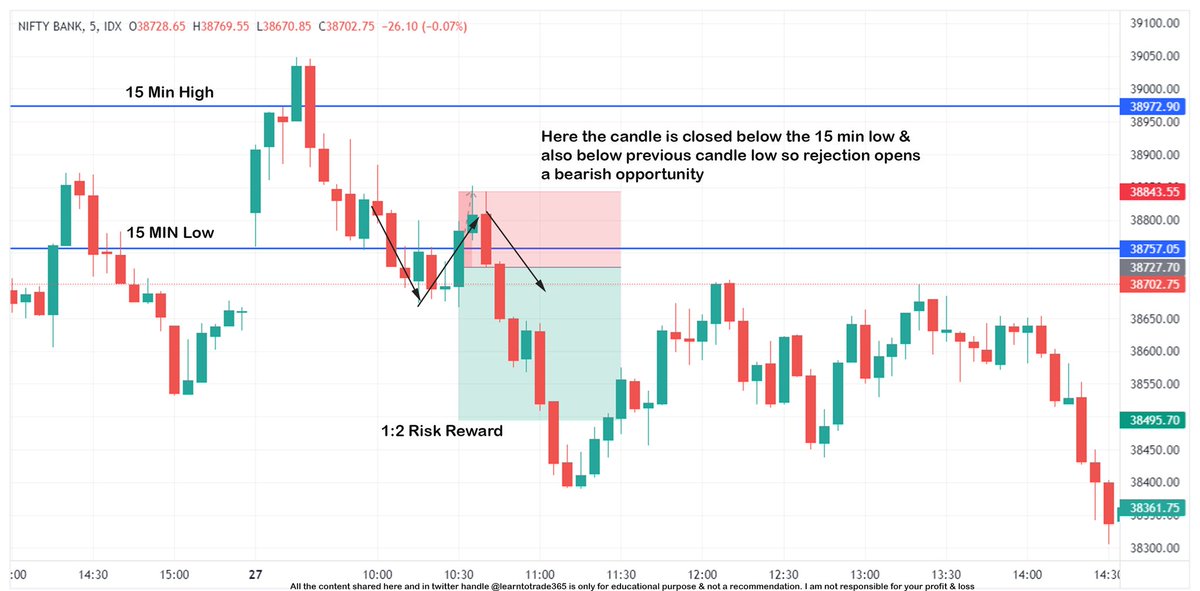
Everyone want to make money from trading but ultimately traders who's main focus is on following the PRICE with risk management end up making big money from trading

Focus on Price. Rest is Noise

Chart 3 Scroll down ๐Ÿ‘‡

More from Catagory trading

๐—›๐—ผ๐˜„ ๐˜๐—ผ ๐—ฐ๐—ฟ๐—ฒ๐—ฎ๐˜๐—ฒ ๐˜†๐—ผ๐˜‚๐—ฟ ๐—ผ๐˜„๐—ป ๐—–๐—ต๐—ฎ๐—ฟ๐˜๐—ถ๐—ป๐—ธ ๐—ฆ๐—ฐ๐—ฟ๐—ฒ๐—ฒ๐—ป๐—ฒ๐—ฟ

๐Ÿงต Thread ๐Ÿงต
[1/15]

๐—–๐—ต๐—ฎ๐—ฟ๐˜๐—ถ๐—ป๐—ธ ๐—ฆ๐—ฐ๐—ฟ๐—ฒ๐—ฒ๐—ป๐—ฒ๐—ฟ is a Stock screening tool that is useful to screen stocks based on Technical & Fundamentals.
๐Ÿ”ธ It scans stocks by using technical indicators like RSI, MACD, divergences, etc.
๐Ÿ”ธ It also uses fundamental tools like Book Value, EPS,PE etc
[2/15]

How To Create A Scan ?
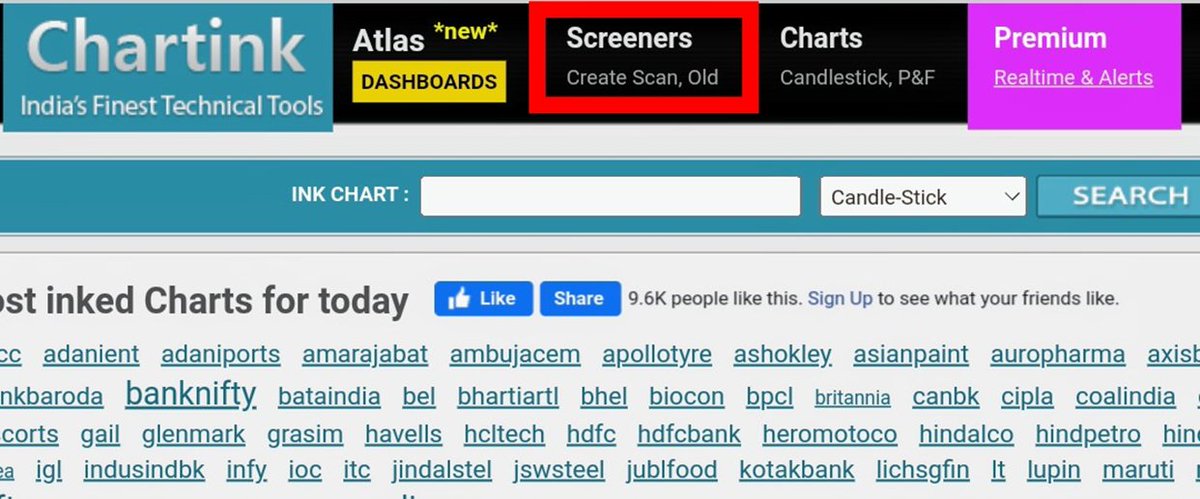
Go to
https://t.co/JJEJBg3Cd8 & click on ๐˜Š๐˜ณ๐˜ฆ๐˜ข๐˜ต๐˜ฆ ๐˜š๐˜ค๐˜ข๐˜ฏ under ๐˜š๐˜ค๐˜ณ๐˜ฆ๐˜ฆ๐˜ฏ๐˜ฆ๐˜ณ๐˜ด.

[3/15]


๐—™๐—ถ๐—ฟ๐˜€๐˜ ๐—ฆ๐˜๐—ฒ๐—ฝ ๐—ง๐—ผ ๐—™๐—ถ๐—น๐˜๐—ฒ๐—ฟ ๐—ฆ๐˜๐—ผ๐—ฐ๐—ธ๐˜€
We can select segments of stocks of our choice, e.g. cash or futures stocks, Nifty 100 etc.
Click on green โ€˜+โ€™ icon to add conditions.
[4/15]


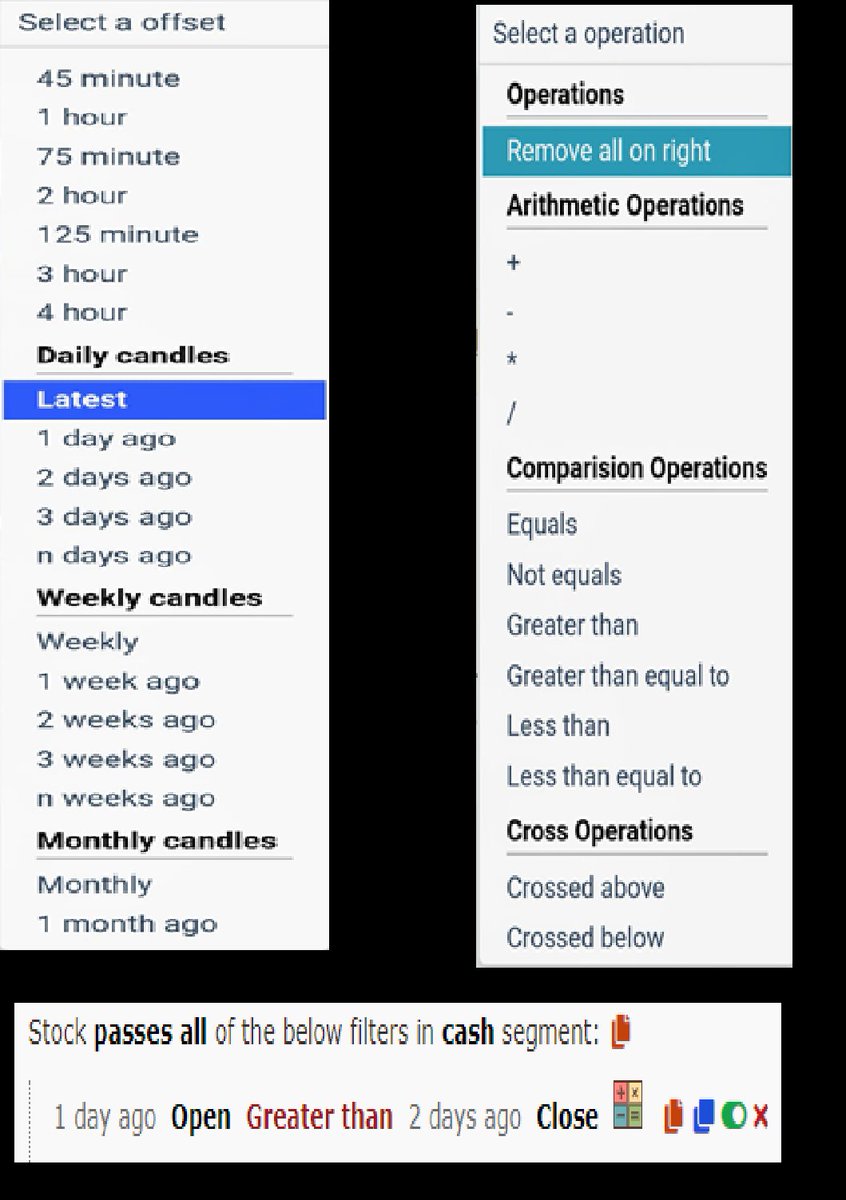
๐—–๐—ฎ๐—ป๐—ฑ๐—น๐—ฒ ๐—ง๐—ถ๐—บ๐—ฒ๐—ณ๐—ฟ๐—ฎ๐—บ๐—ฒ๐˜€ & ๐—–๐—ผ๐—บ๐—ฝ๐—ฎ๐—ฟ๐—ถ๐˜€๐—ผ๐—ป ๐—ข๐—ฝ๐—ฒ๐—ฟ๐—ฎ๐˜๐—ผ๐—ฟ๐˜€๐Ÿ”ธ We can select any timeframe of candles in Chartink, from minutes to years.
๐Ÿ”ธ And compare two candles using comparison operators like ๐˜Œ๐˜ฒ๐˜ถ๐˜ข๐˜ญ ๐˜ต๐˜ฐ or ๐˜Ž๐˜ณ๐˜ฆ๐˜ข๐˜ต๐˜ฆ๐˜ณ ๐˜›๐˜ฉ๐˜ข๐˜ฏ , crossovers etc
[5/15]

You May Also Like