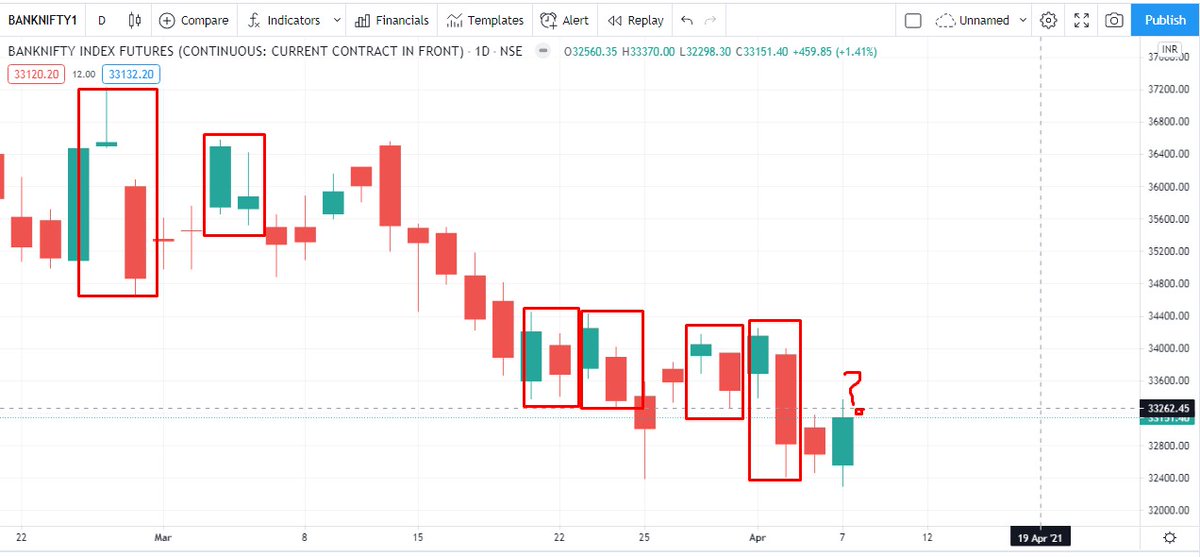
In technical analysis, majority of the patterns were first observed visually and then the rules made. Observing this interesting phenomenon on BNF over the past one month.
Any strong up day on BNF is immediately followed by a gap down open from the previous closing
Technical analysis of stock trends by Edwards and Magee
https://t.co/O8yWYpWC2W
More from Subhadip Nandy
The most important question now on the mind of all analysts and traders. Is this a bear market rally or is this the start of a bull move. Retweeting this as I will need a few tweets to explain my view
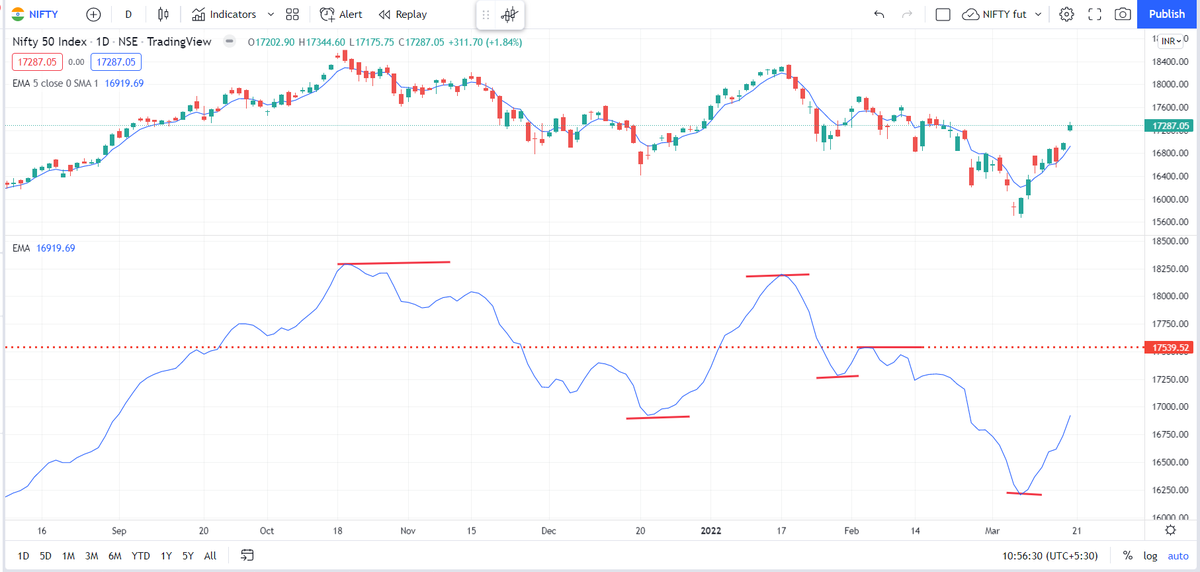
Everyone knows the HH-HL or LH-LL as per Dow theory. This can be a bit confusing on how one marks the Highs and Lows. Long back, I picked up this trick from one of the neo-Dow theorists on what to do in scenarios like this
Simply plot a 5 period exponential moving average on a different panel. A 5-EMA simply shows you a running weekly perspective and kind of smoothens the price where a single spike high/low is not of that much importance
You will see this 5-ema also making HH.HL.LH.LL. So now, rather than focusing on the highs/lows on the charts, focusing on highs/lows on the 5-ema gives a cleaner perspective
As per this charts, unless the 5-ema now closes above 17540 ( the ema, not Nifty price) I will not play this as a bull market. I will deal with this market as a counter move against the major bear trend
Is Nifty bullish, or bearish?
— AP (@ap_pune) March 19, 2022
Replies MUST be ONLY with charts, not just 'views', no Russia Ukraine, crude, gold etc.
Can be levels....abv/below
Just technicals....maybe with trend lines, indicators or any other study (EW, harmonics etc)
Charts can be daily, weekly or monthly.
Everyone knows the HH-HL or LH-LL as per Dow theory. This can be a bit confusing on how one marks the Highs and Lows. Long back, I picked up this trick from one of the neo-Dow theorists on what to do in scenarios like this
Simply plot a 5 period exponential moving average on a different panel. A 5-EMA simply shows you a running weekly perspective and kind of smoothens the price where a single spike high/low is not of that much importance
You will see this 5-ema also making HH.HL.LH.LL. So now, rather than focusing on the highs/lows on the charts, focusing on highs/lows on the 5-ema gives a cleaner perspective
As per this charts, unless the 5-ema now closes above 17540 ( the ema, not Nifty price) I will not play this as a bull market. I will deal with this market as a counter move against the major bear trend