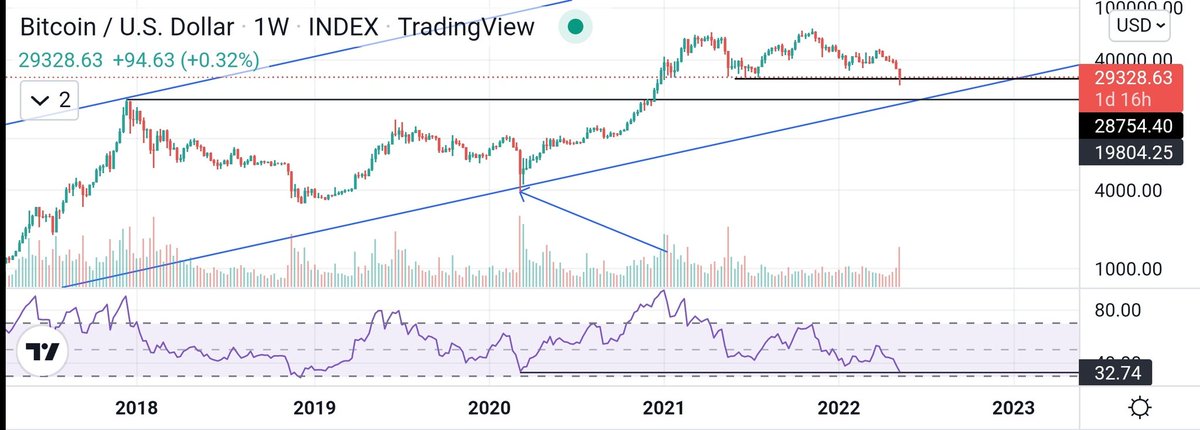
If it breaks the expanding triangle on closing basis, we are looking at 20-25% correction from here.
Daily RSI was oversold at the bottom and failed to come over 30 in last 2 days.
Worrisome signs.


#BITCOIN
— Mayank Narula (@Mayank_Narula1) March 5, 2022
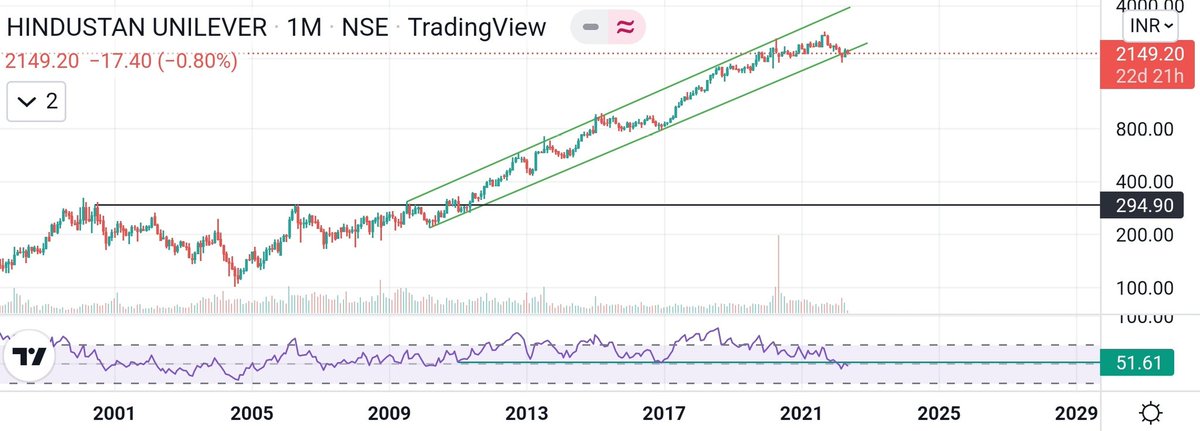
Pending RSI divergence on monthly chart which requires a dip under 13805 to get resolved.
But monthly RSI divergences can go on for years before the resolution.
Best case scenario will be panic dump over next few months. pic.twitter.com/hi67hMg9sZ


Donald Barr had a way with words. pic.twitter.com/JdRBwXPhJn
— Rudy Havenstein, listening to Nas all day. (@RudyHavenstein) September 17, 2020