

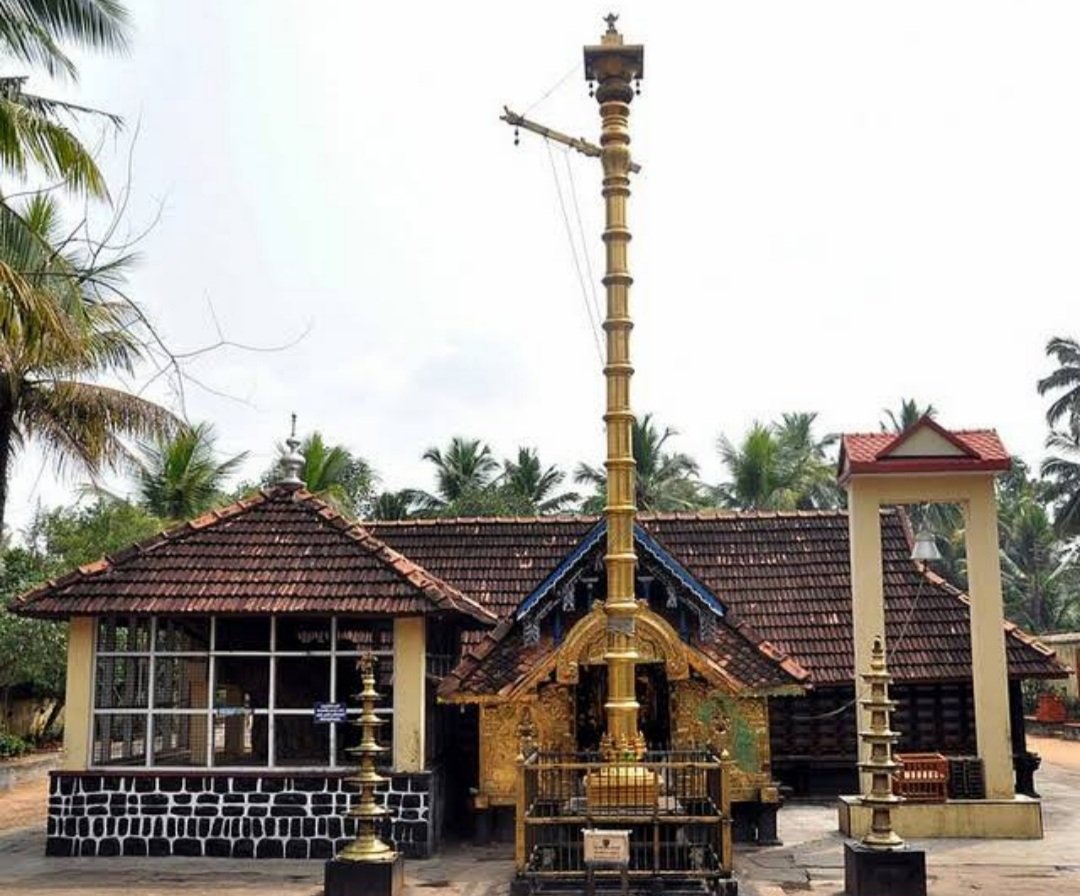
Dakshinamoorthy Kshetram,Sukapuram
#Malappuram
#Keralatemples 🚩
Dakshina Moorthy Kshetram is located in Edappal. Paramashiva is worshipped as Dakhinamurthy here. Kshetram is very unique because, no festival is celebrated here as it might disturb the Tapasya of Paramashiva.

But this was before the auspicious time. At the time informed by the Maharshi, a peacock came to the temple and sat in balikallu


More from Anu Satheesh 🇮🇳


More from All


How can we use language supervision to learn better visual representations for robotics?
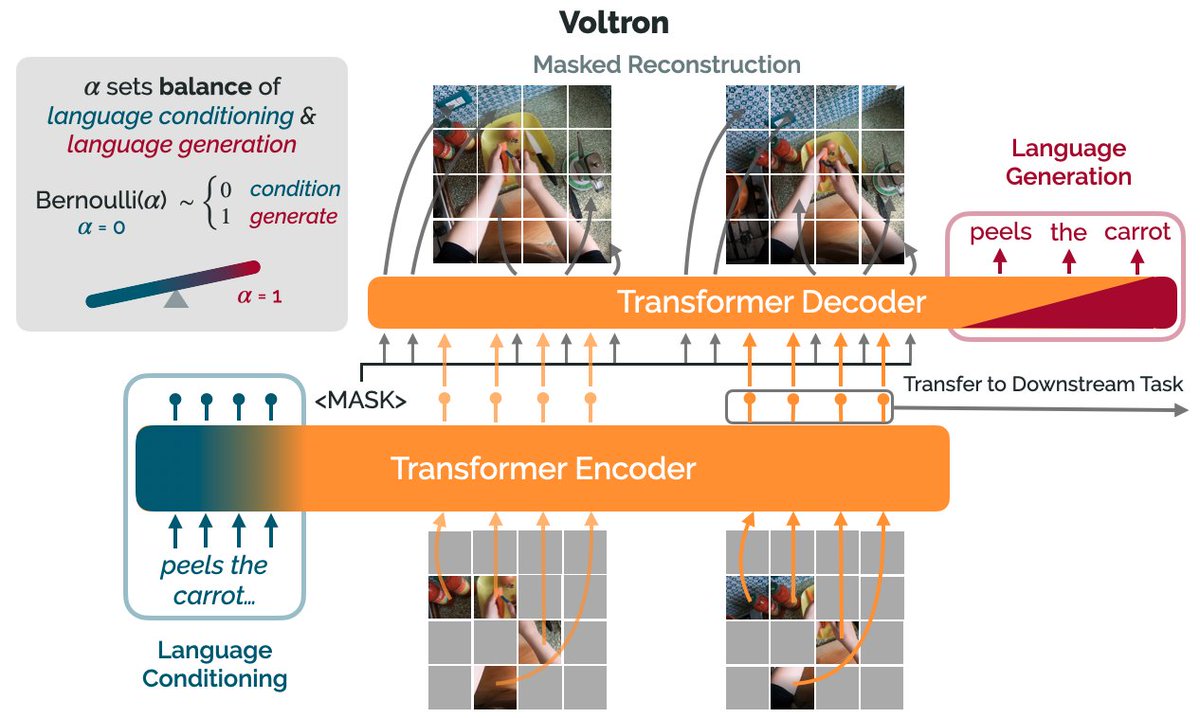
Introducing Voltron: Language-Driven Representation Learning for Robotics!
Paper: https://t.co/gIsRPtSjKz
Models: https://t.co/NOB3cpATYG
Evaluation: https://t.co/aOzQu95J8z
🧵👇(1 / 12)
Videos of humans performing everyday tasks (Something-Something-v2, Ego4D) offer a rich and diverse resource for learning representations for robotic manipulation.
Yet, an underused part of these datasets are the rich, natural language annotations accompanying each video. (2/12)
The Voltron framework offers a simple way to use language supervision to shape representation learning, building off of prior work in representations for robotics like MVP (https://t.co/Pb0mk9hb4i) and R3M (https://t.co/o2Fkc3fP0e).
The secret is *balance* (3/12)
Starting with a masked autoencoder over frames from these video clips, make a choice:
1) Condition on language and improve our ability to reconstruct the scene.
2) Generate language given the visual representation and improve our ability to describe what's happening. (4/12)
By trading off *conditioning* and *generation* we show that we can learn 1) better representations than prior methods, and 2) explicitly shape the balance of low and high-level features captured.
Why is the ability to shape this balance important? (5/12)
You May Also Like


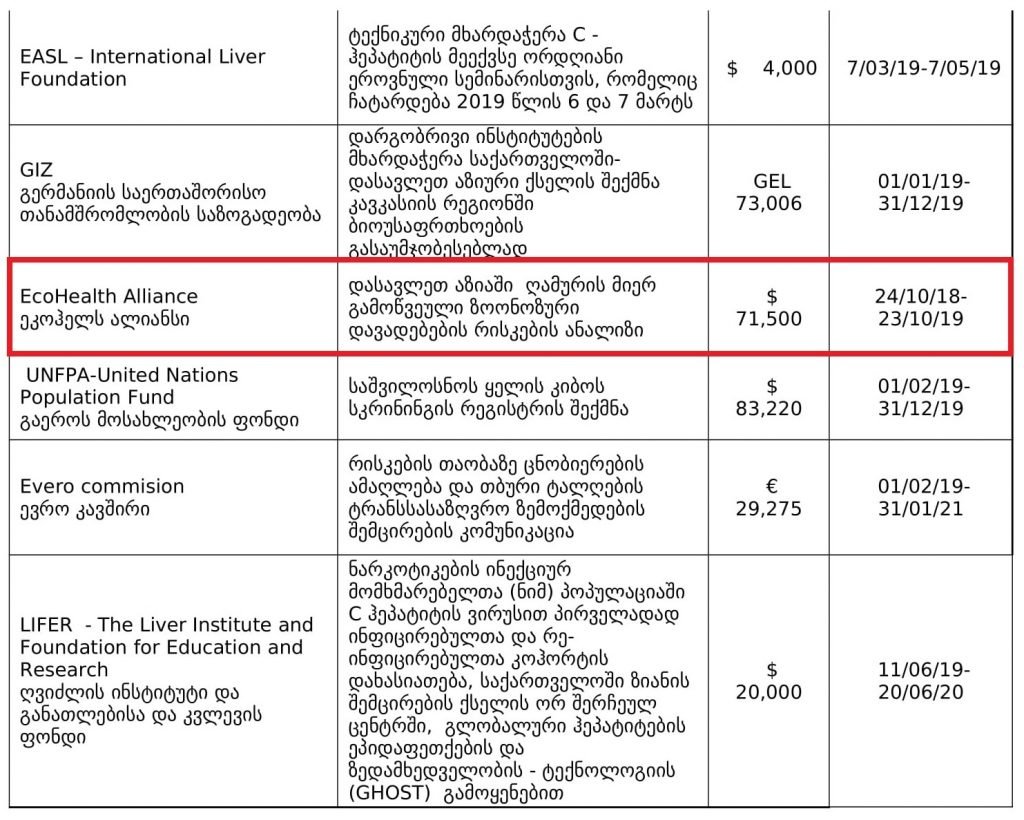
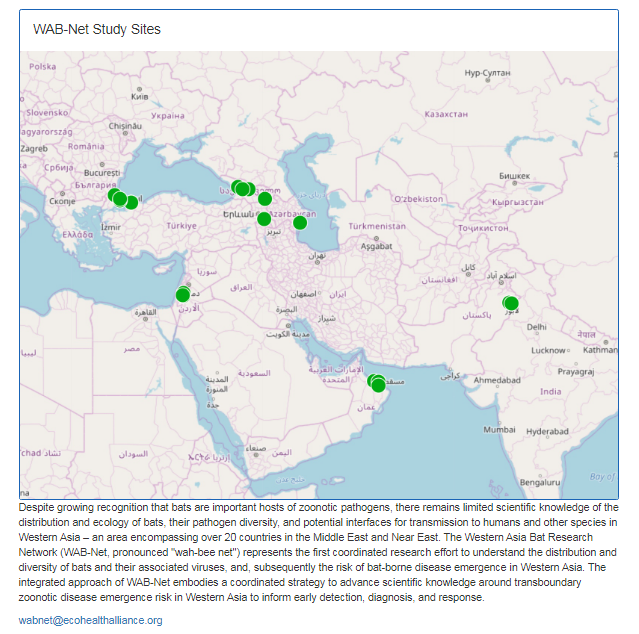
1. Project 1742 (EcoHealth/DTRA)
Risks of bat-borne zoonotic diseases in Western Asia
Duration: 24/10/2018-23 /10/2019
Funding: $71,500
@dgaytandzhieva
https://t.co/680CdD8uug
2. Bat Virus Database
Access to the database is limited only to those scientists participating in our ‘Bats and Coronaviruses’ project
Our intention is to eventually open up this database to the larger scientific community
https://t.co/mPn7b9HM48
3. EcoHealth Alliance & DTRA Asking for Trouble
One Health research project focused on characterizing bat diversity, bat coronavirus diversity and the risk of bat-borne zoonotic disease emergence in the region.
https://t.co/u6aUeWBGEN
4. Phelps, Olival, Epstein, Karesh - EcoHealth/DTRA
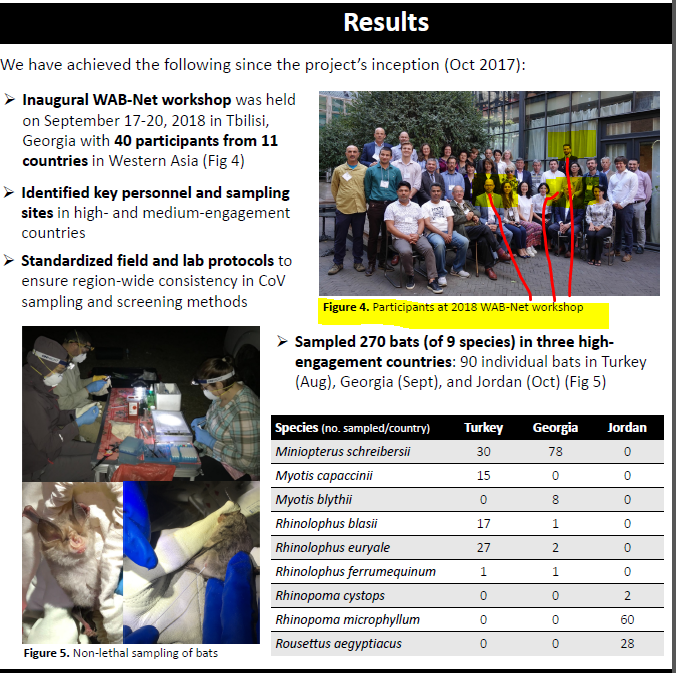
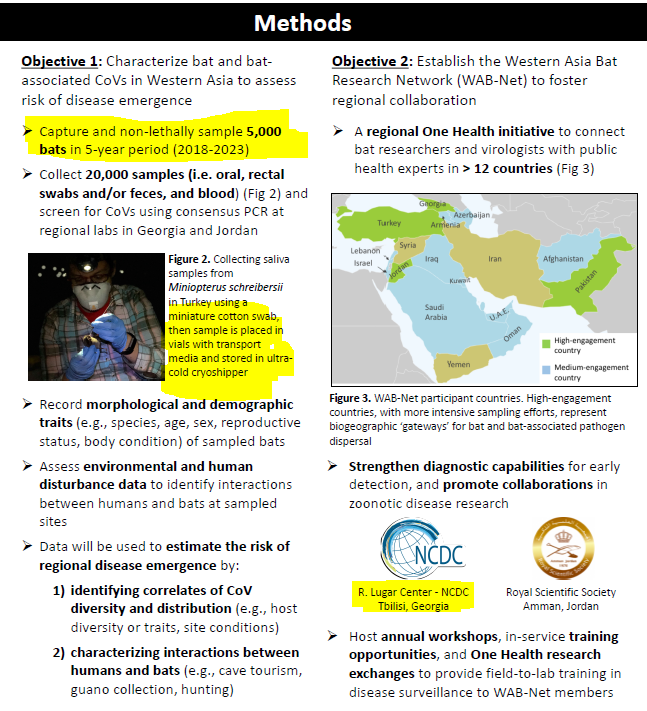
5, Methods and Expected Outcomes
(Unexpected Outcome = New Coronavirus Pandemic)
Risks of bat-borne zoonotic diseases in Western Asia
Duration: 24/10/2018-23 /10/2019
Funding: $71,500
@dgaytandzhieva
https://t.co/680CdD8uug
2. Bat Virus Database
Access to the database is limited only to those scientists participating in our ‘Bats and Coronaviruses’ project
Our intention is to eventually open up this database to the larger scientific community
https://t.co/mPn7b9HM48
3. EcoHealth Alliance & DTRA Asking for Trouble
One Health research project focused on characterizing bat diversity, bat coronavirus diversity and the risk of bat-borne zoonotic disease emergence in the region.
https://t.co/u6aUeWBGEN
4. Phelps, Olival, Epstein, Karesh - EcoHealth/DTRA
5, Methods and Expected Outcomes
(Unexpected Outcome = New Coronavirus Pandemic)


1/OK, data mystery time.
This New York Times feature shows China with a Gini Index of less than 30, which would make it more equal than Canada, France, or the Netherlands. https://t.co/g3Sv6DZTDE
That's weird. Income inequality in China is legendary.
Let's check this number.
2/The New York Times cites the World Bank's recent report, "Fair Progress? Economic Mobility across Generations Around the World".
The report is available here:
3/The World Bank report has a graph in which it appears to show the same value for China's Gini - under 0.3.
The graph cites the World Development Indicators as its source for the income inequality data.

4/The World Development Indicators are available at the World Bank's website.
Here's the Gini index: https://t.co/MvylQzpX6A
It looks as if the latest estimate for China's Gini is 42.2.
That estimate is from 2012.
5/A Gini of 42.2 would put China in the same neighborhood as the U.S., whose Gini was estimated at 41 in 2013.
I can't find the <30 number anywhere. The only other estimate in the tables for China is from 2008, when it was estimated at 42.8.
This New York Times feature shows China with a Gini Index of less than 30, which would make it more equal than Canada, France, or the Netherlands. https://t.co/g3Sv6DZTDE
That's weird. Income inequality in China is legendary.
Let's check this number.
2/The New York Times cites the World Bank's recent report, "Fair Progress? Economic Mobility across Generations Around the World".
The report is available here:
3/The World Bank report has a graph in which it appears to show the same value for China's Gini - under 0.3.
The graph cites the World Development Indicators as its source for the income inequality data.
4/The World Development Indicators are available at the World Bank's website.
Here's the Gini index: https://t.co/MvylQzpX6A
It looks as if the latest estimate for China's Gini is 42.2.
That estimate is from 2012.
5/A Gini of 42.2 would put China in the same neighborhood as the U.S., whose Gini was estimated at 41 in 2013.
I can't find the <30 number anywhere. The only other estimate in the tables for China is from 2008, when it was estimated at 42.8.