Categories screeners
7 days
30 days
All time
Recent
Popular

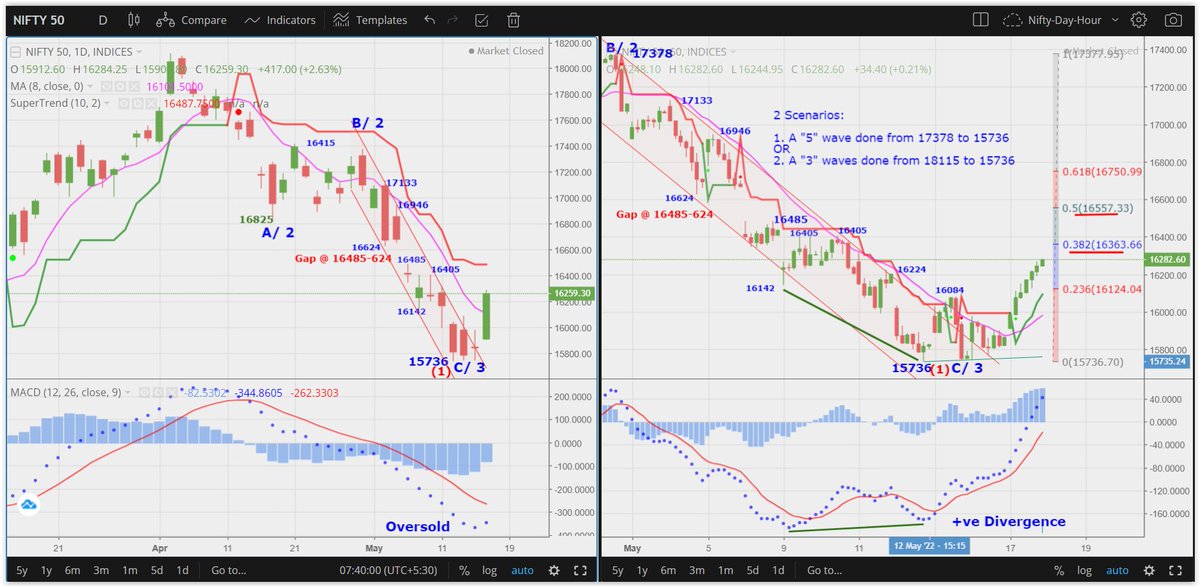

Bringing Data Science to Nifty Analysis. A small 🧵
As per Normal Distribution 68% of the time movement is with 1% SD Limits.
For 95% pf the times movement is within 2% SD limits.
And its only 0.3% of the times that movement exceeds 3 SD.
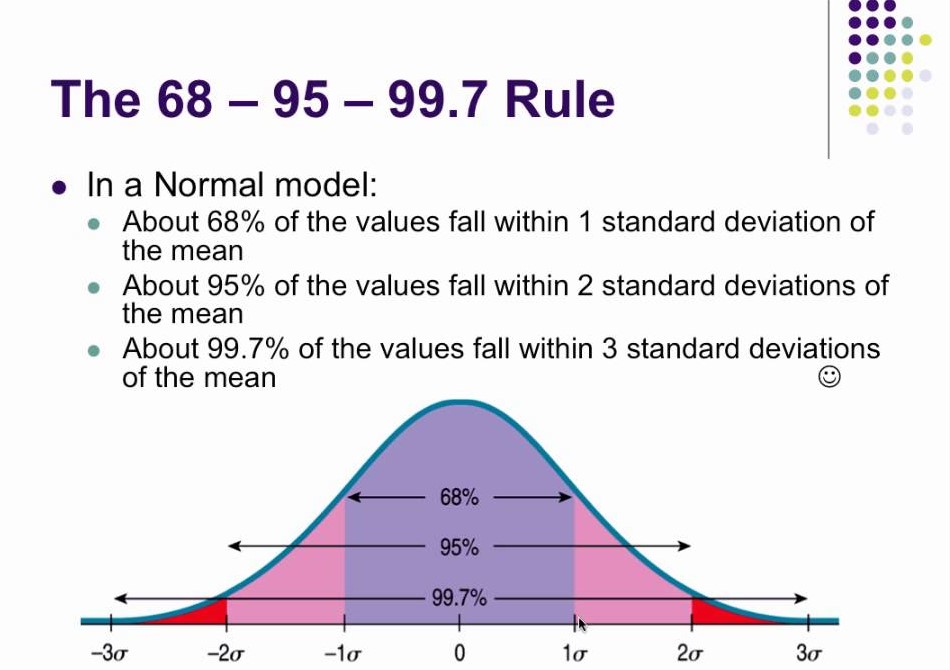
Since 95% covers a lot of ground that's why 2SD is considered to be a a safe range for most events.
The farther we move from the average, chances of occurrence go down. This is what Taleb sahab calls Tail risk, because it lies in the tail of the standard distribution curve.
Normal distribution occurs everywhere. See this
Bollinger Band, which is a very popular indicator has a setting of 2SD. Because its expected that 95% of the time moves will be confined to 2SD limits.
When we say that price is at upper/lower Bollinger band, we are saying that it has reached 2 SD limits and likely to reverse.
Now coming to current scenario, open Nifty daily chart and apply two bollinger Bands on it.
First with default setting and in second change settings to 3 standard deviation.
Crossing 3 SD boundary means that Nifty is now in very rare territory where it has been only 0.3%
As per Normal Distribution 68% of the time movement is with 1% SD Limits.
For 95% pf the times movement is within 2% SD limits.
And its only 0.3% of the times that movement exceeds 3 SD.
Since 95% covers a lot of ground that's why 2SD is considered to be a a safe range for most events.
The farther we move from the average, chances of occurrence go down. This is what Taleb sahab calls Tail risk, because it lies in the tail of the standard distribution curve.
Normal distribution occurs everywhere. See this
The Galton Machine shows order from randomness. Each ball bounces left or right at random, 12 times, but together where they fall can be predicted - the normal distribution. This one made by: https://t.co/oI9wOGq7nG pic.twitter.com/VQtVu66OSE
— Tom Stafford (@tomstafford) April 19, 2018
Bollinger Band, which is a very popular indicator has a setting of 2SD. Because its expected that 95% of the time moves will be confined to 2SD limits.
When we say that price is at upper/lower Bollinger band, we are saying that it has reached 2 SD limits and likely to reverse.
Now coming to current scenario, open Nifty daily chart and apply two bollinger Bands on it.
First with default setting and in second change settings to 3 standard deviation.
Crossing 3 SD boundary means that Nifty is now in very rare territory where it has been only 0.3%

Exit krna sekhlo agle bull run ke liye, jisse ke same mistakes repeat na ho !!
Har stock turn down hota hai ! Exiting helps beating markets & catching new ones
Har stock turn down hota hai ! Exiting helps beating markets & catching new ones
Without rules you cannot conquer markets !
— EquiAlpha -MidTerm Momentum\U0001f40e\U0001f40e (@equialpha) May 3, 2022
These are my 9 sell warriors to conquer markets !
Selling is the toughest part..Some or the other sell rule always get me out !
Learn fully - https://t.co/iDlVff5KoU pic.twitter.com/u2vQvpGzEs