
You ask me or any other persons, they'll tell you their subjective view however unbiased they attempt to be.
It is their view and not necessarily the market's.
My subjective view is labelled in the charts.
Follow #Priceaction https://t.co/37iXFtWPzU
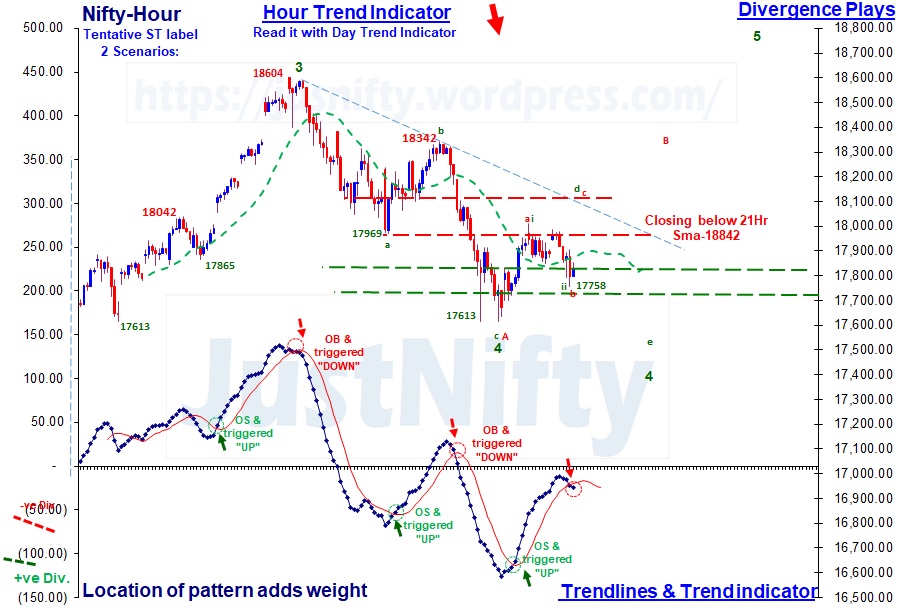
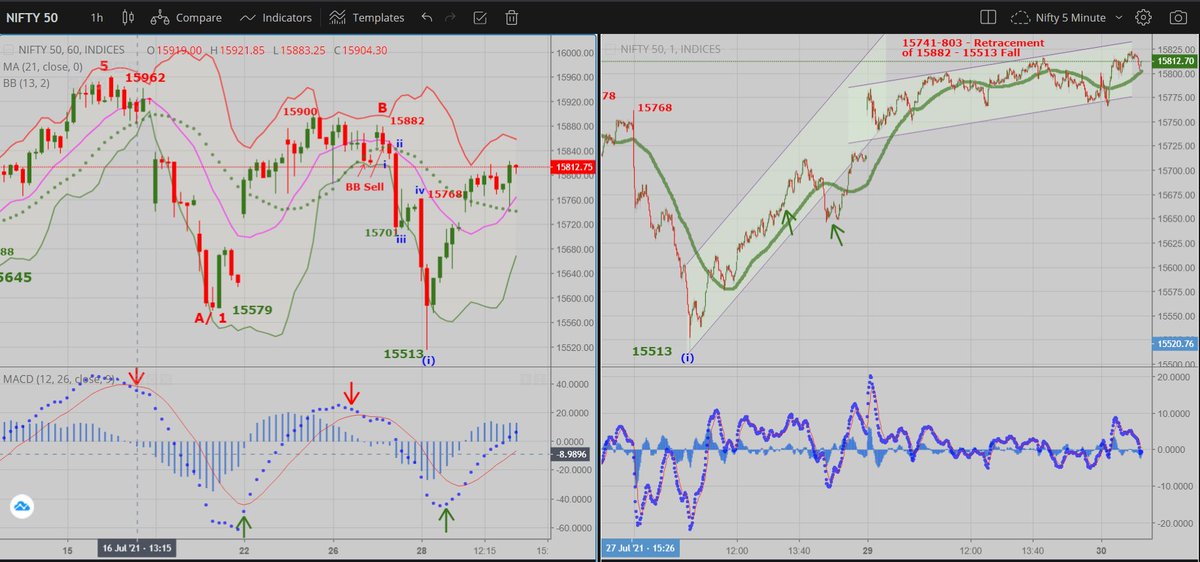
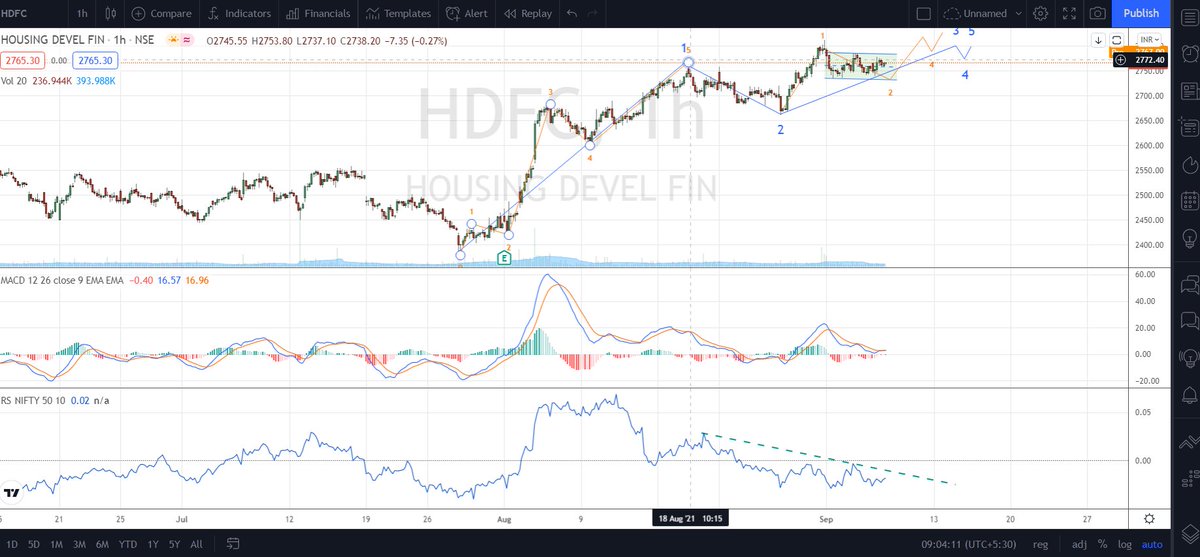
Currently reading the book you put on your website. Also, from this if we consider 18600 as 5 th wave end of Nifty ideally it's doing the 1st 12345 of downtrend, of which do e already 1234, currently going towards 5 which I believe should go below 100% of 4th retracement wave
— de soloist \U0001f1ee\U0001f1f3 (@ChakiArijit) November 4, 2021
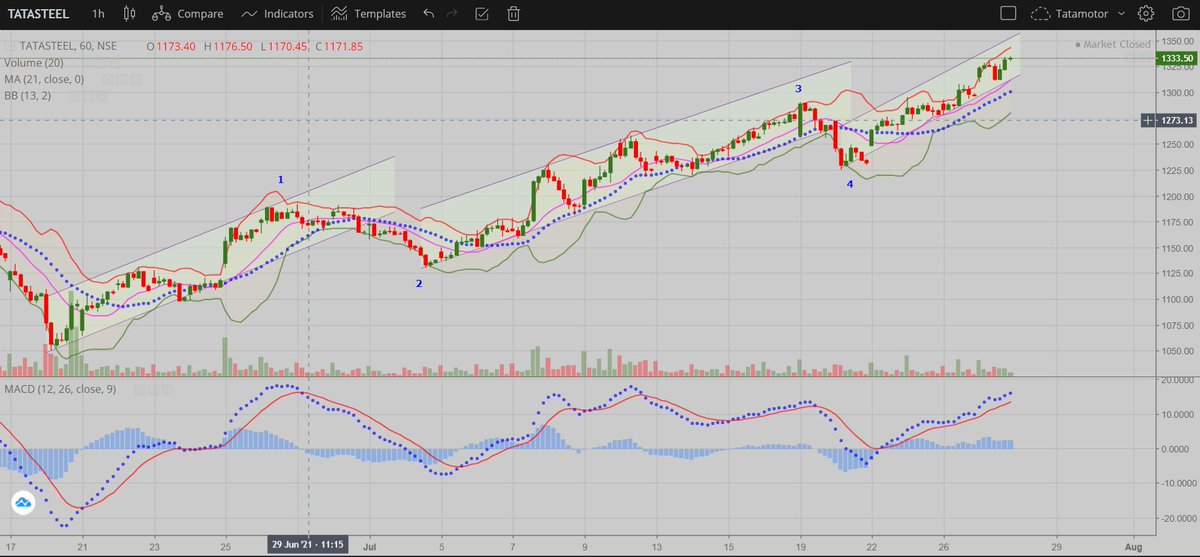
Read again till you understand the logic fully of a "Moving avg (13Sma) & its upper & lower band" mechanism and then,
Apply on charts of your short listed stocks and understand how the trades/ investments would have worked -back testing
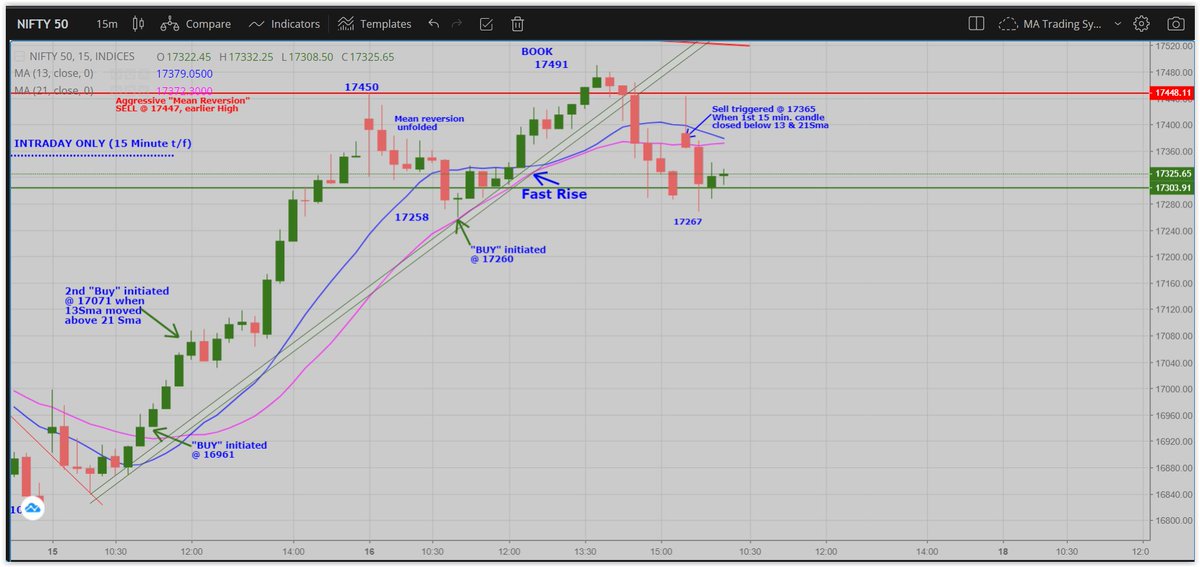
Bollinger band has been a trusted guide with the settings of 13sma & 2 std deviation. Add to it 5 & 8 smas and it works in all time frames.
— Van Ilango (JustNifty) (@JustNifty) September 29, 2020
Start from week & Day for investments; Hour & 5 minute for intraday.
Experiment initially; you'll still need other tools to read the mkt\U0001f600\U0001f64f pic.twitter.com/yEkHiDHiha
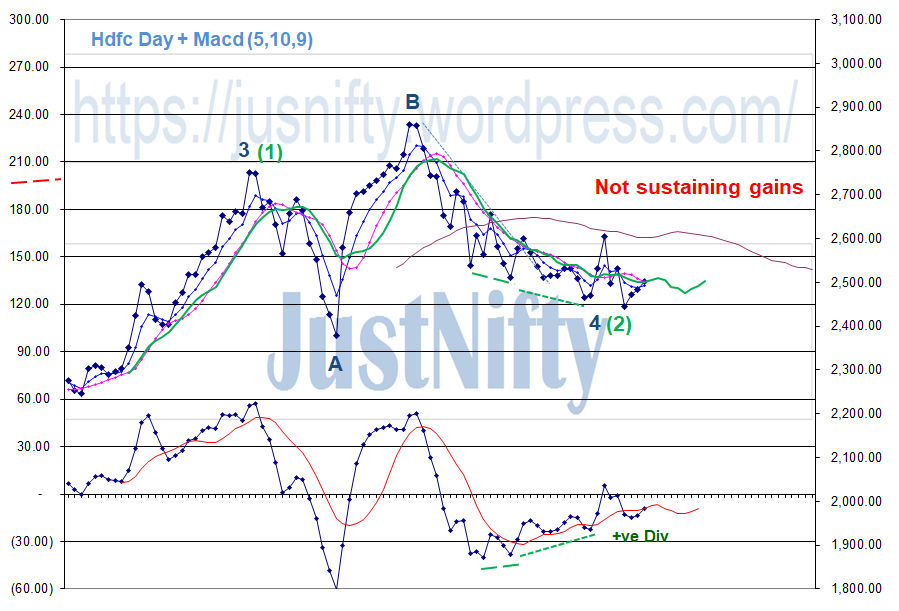
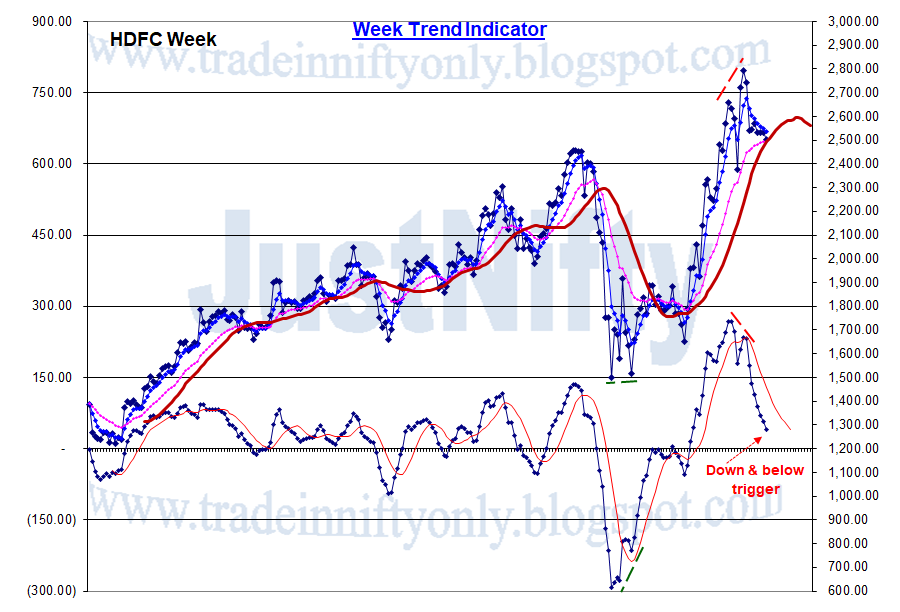
#Hdfc (3190++)
#Hdfcbank (1724++)
#Reliance (2834++)
#ITC (274++) these are "just min. targets"
& many more would move up significantly
@rlnarayanan https://t.co/iVYE1F7l6v
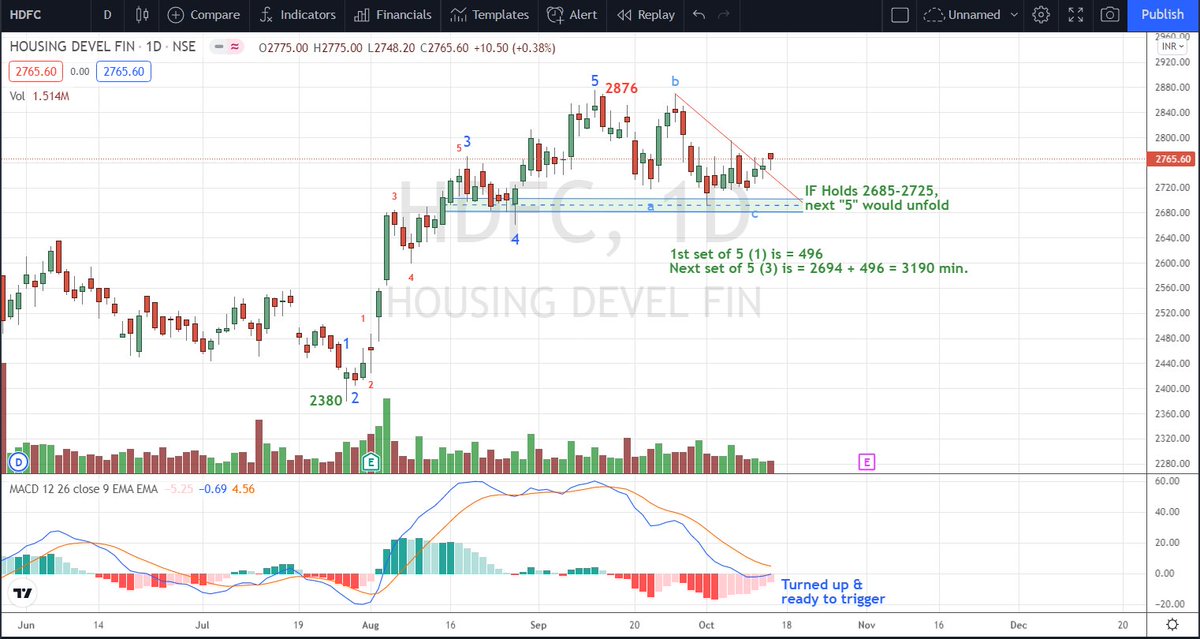
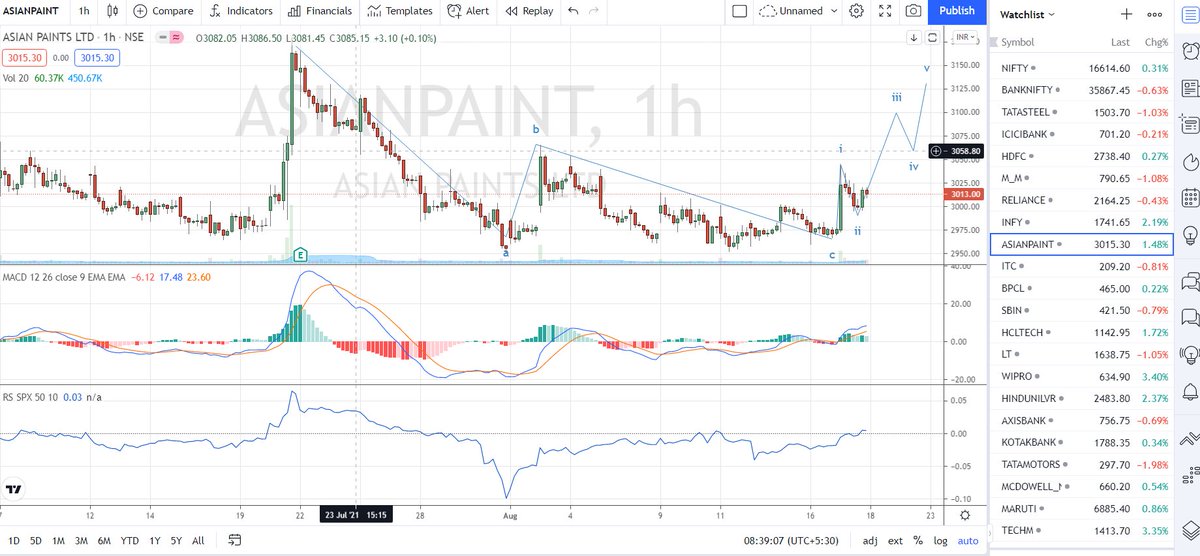
#Nifty 3rd is sub-dividing as in chart:
— Van Ilango (JustNifty) (@JustNifty) October 13, 2021
[1]st: 16396 - 17793 = 1397
[2]nd: 17793-17948-17453 - Irregular flat
[3]rd: 17453+1397=18850 OR
: 17453+1928=19381 OR
: 17453+2096=19549 OR
: 17453+2260=19713 OR
Nothing wrong in projecting till holds "17990"
#Elliottwave puts #PriceAction in it's context
— Van Ilango (JustNifty) (@JustNifty) December 2, 2021
You're 1 undisputed expert on prime source of everything, #PriceAction
Let beginner start with #PriceAction & then step up to 12345 & ABC
Baby steps alone will take to maturity
Read this book months ago - "Rich Experience shared"\U0001f64f https://t.co/VUbG6F5Ems pic.twitter.com/PProaFsMsV
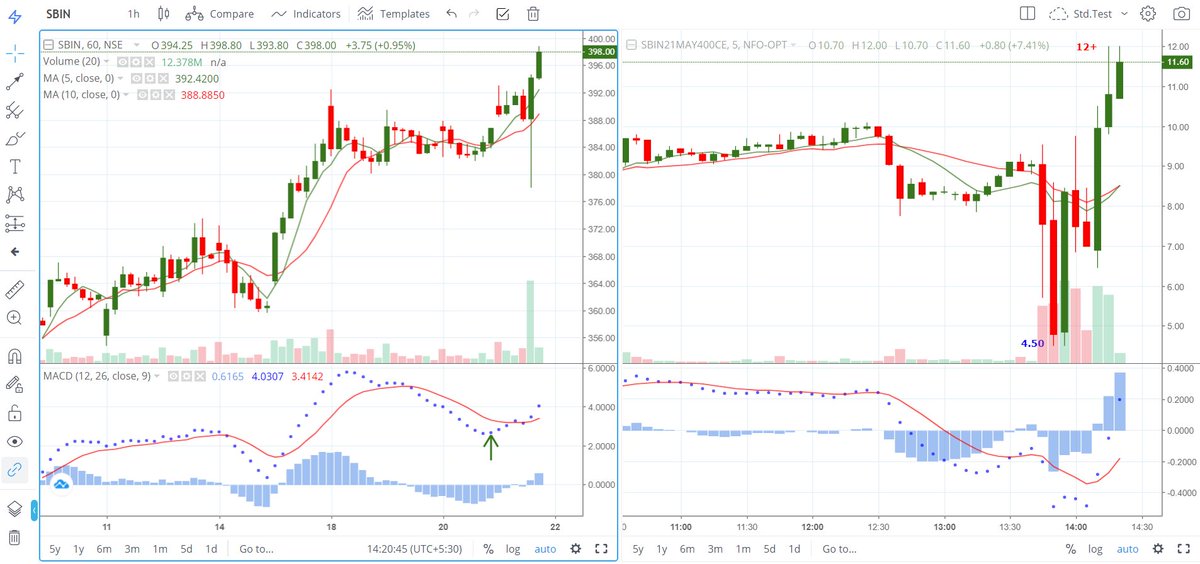
His simple mechanical system of MACD multi t/f with 4 Hour setting seems to remove whipsaws & is producing amazing result with #Nifty
Experience speaks - you listen and adopt
Develop patience to wait for such good set up. Now trail your SL once price has gains https://t.co/jC8tcrZ0Cv
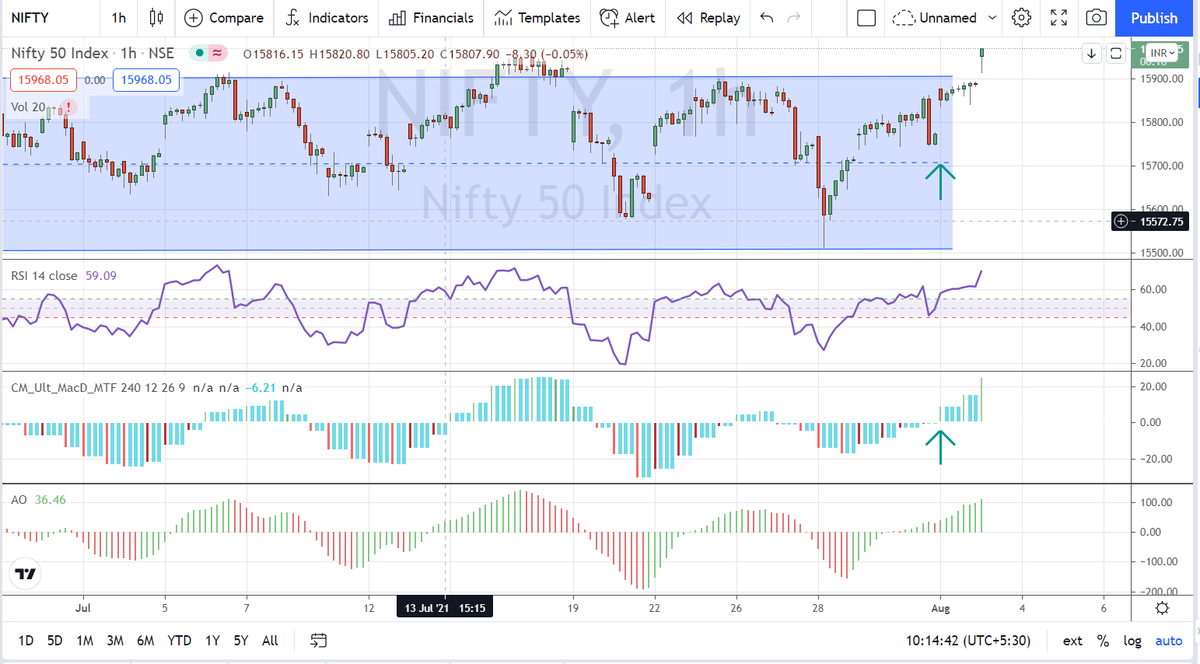
Book mark this and revisit every day or every week till you get it right as a trader. Coming from an experienced trader like @MaverickAmit01 , it's priceless.
— Van Ilango (JustNifty) (@JustNifty) July 31, 2021
Wish we had it when we started out.\U0001f64f https://t.co/0NYKqedy9w
2 Strategies I liked:
1. Plot ATM week CE/PE charts with VWAP & OI Change. Buy when prices move past VWAP while OI starts to move down.
2. Plot ATM Mth CE/ PE with AVWAP. If above, buy wk CE/PE
master can you give few key points in english. Saw the entire video with subtitles but did not understand.
— bala (@BalaThink) March 13, 2022
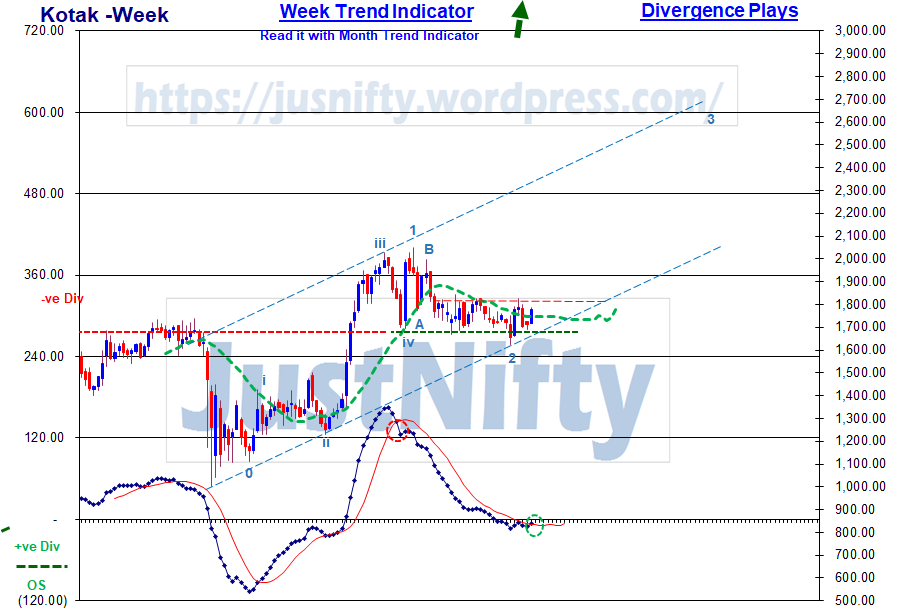
Holding 660 & 680, poised for big run in the days, weeks & months ahead.
Volume goes with rises
Thank you.\U0001f64f
— Van Ilango (JustNifty) (@JustNifty) August 18, 2021
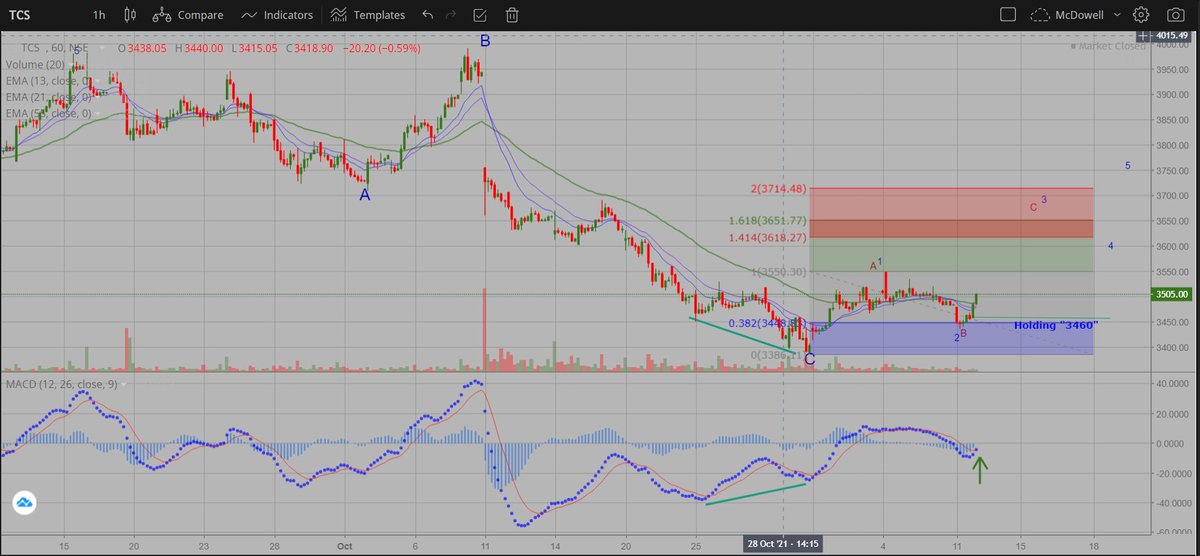
A fresh input for you. #McDowell
A major triangle break out in the coming months.
Presently poised to move out of recent consolidation pic.twitter.com/J15F06ODUq