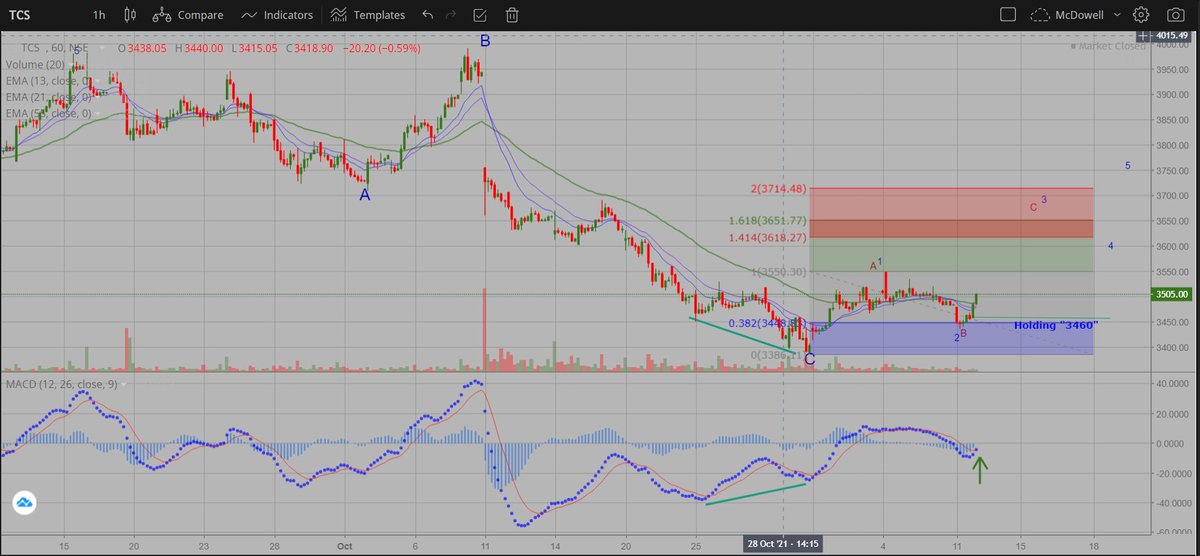
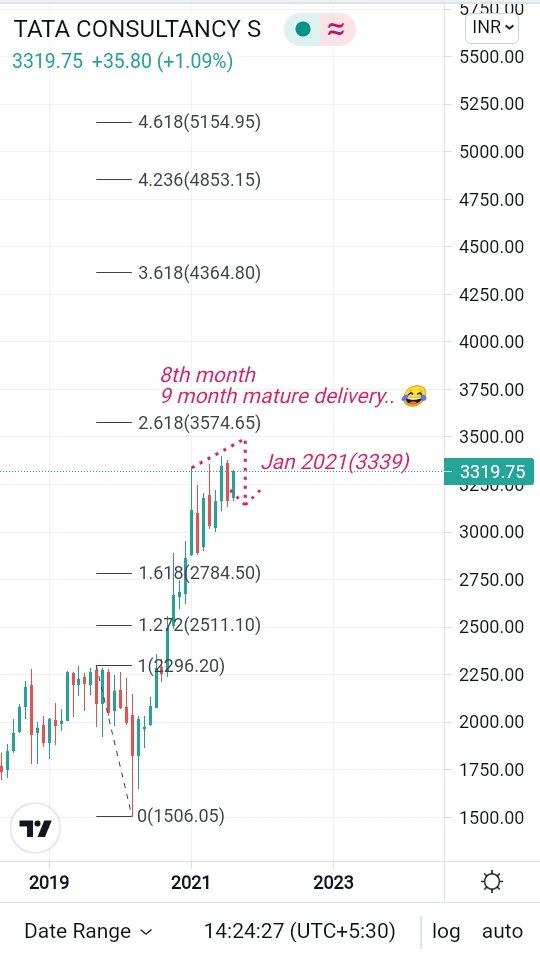
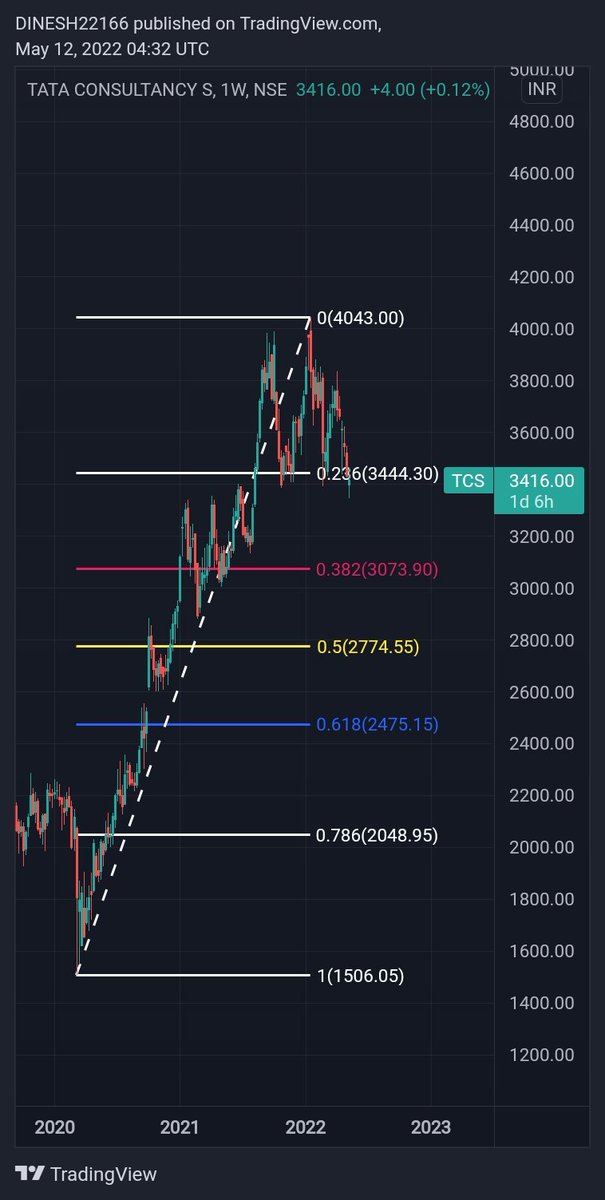
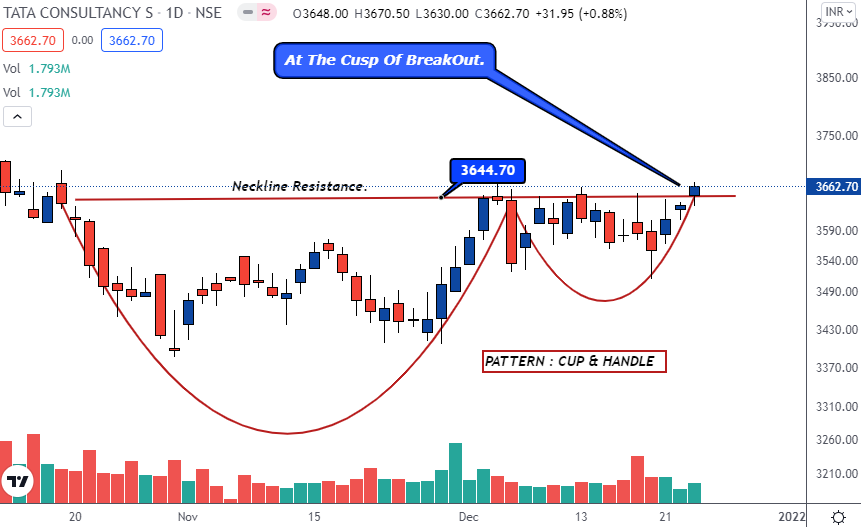
#TCS
Holding 3460-3480, likely to move towards 3600-3650 zone.
#Elliottwave possibility
#Divergence +ve strength
#Trendindicator turning up for ST.
More from Van Ilango (JustNifty)
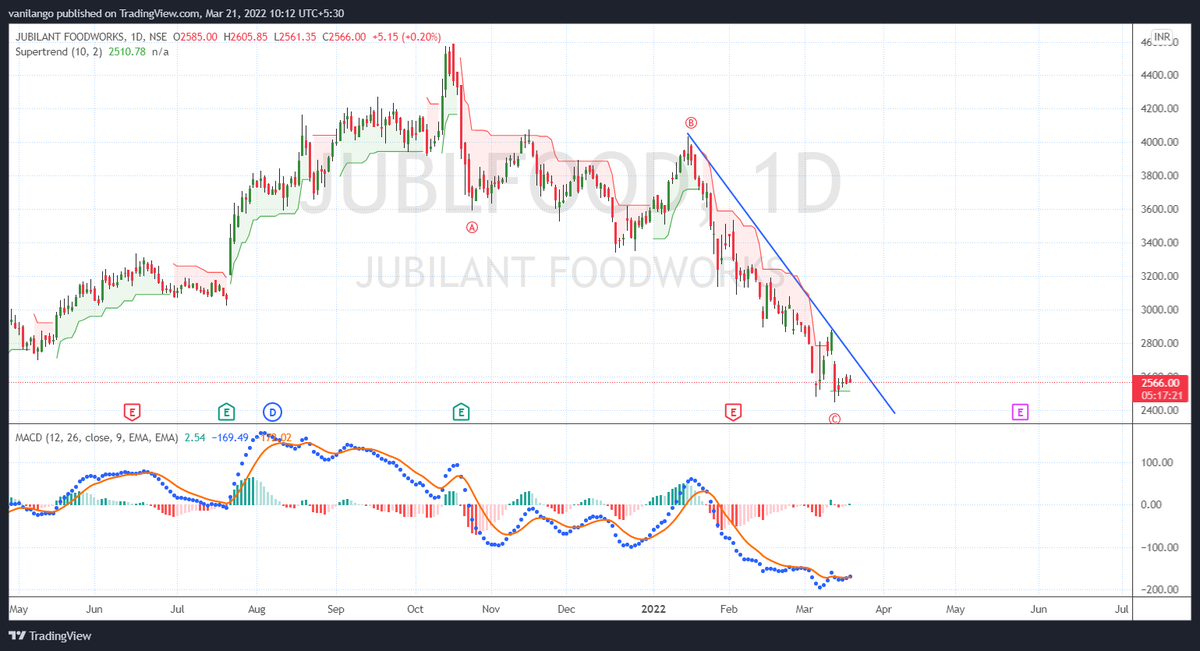
#jubilantfoodworks @ 2443, an "abc" correction is "almost" done fm 4575
Holding 2500 & moving past 2615 would be the 1st sign of reversal attempt
Only +ve factor "Highly oversold"-meant for aggressive traders
Conservative traders wait for some "Bull candle" formation in Day t/f https://t.co/NbwmqJxo0W
Holding 2500 & moving past 2615 would be the 1st sign of reversal attempt
Only +ve factor "Highly oversold"-meant for aggressive traders
Conservative traders wait for some "Bull candle" formation in Day t/f https://t.co/NbwmqJxo0W
sir view on jubilant food works pls
— om namo venkatesaya (@being__trader) March 21, 2022
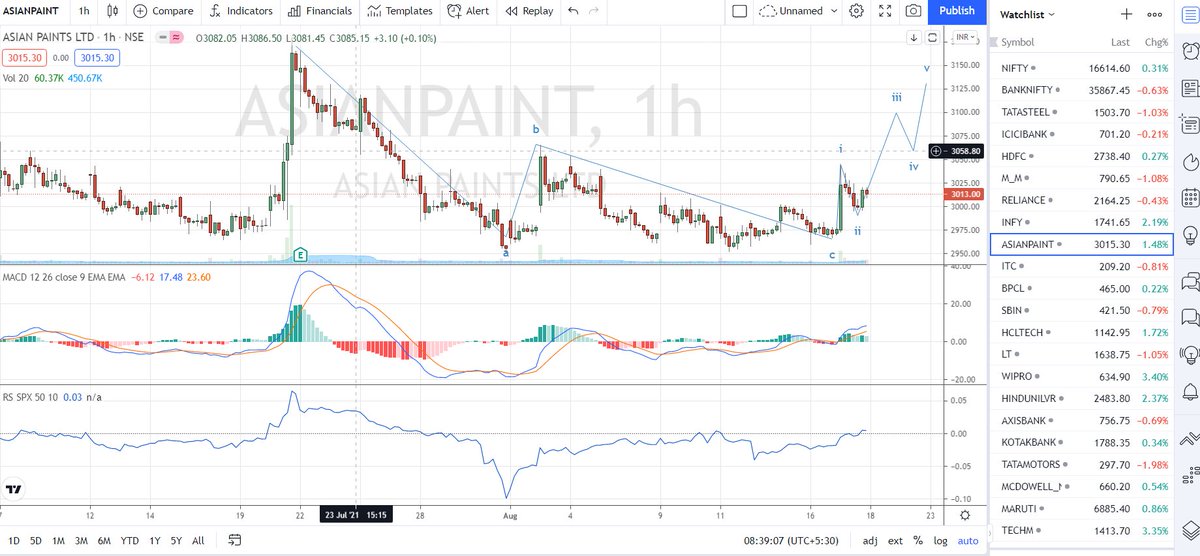
When trending, especially above #movingaverage, ignore this behaviour of #MACD .
I use MACD for reversal points only.
Do not follow it at every 5 minute.
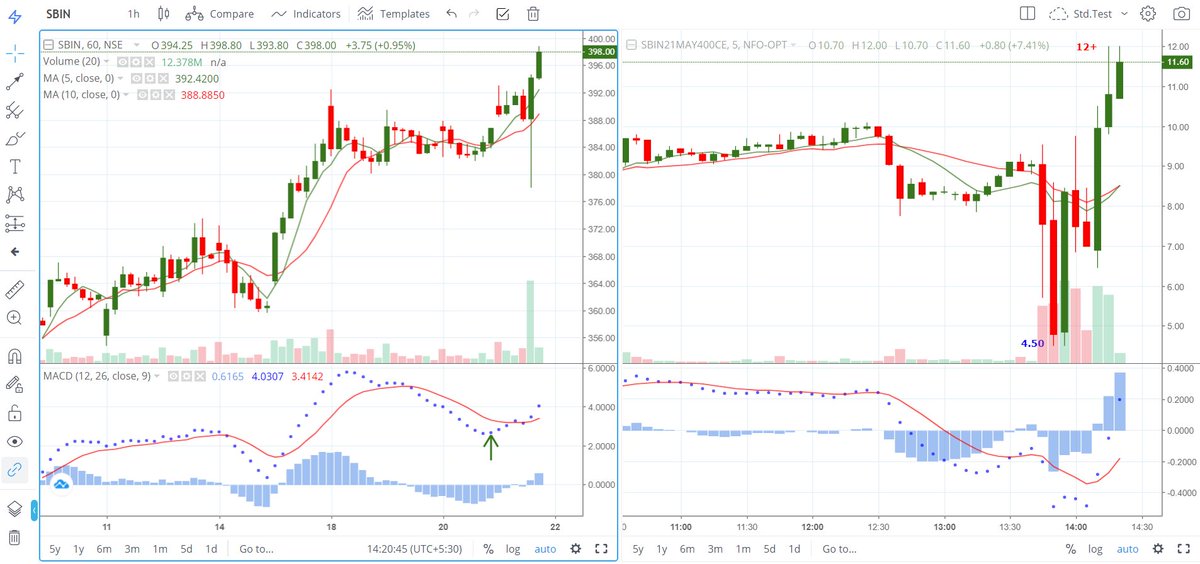
I use MACD for reversal points only.
Do not follow it at every 5 minute.
Yesterday and today both we had MACD divergence . Yet market was just continuing in the opposite direction . Can you please what to do in such case ? . For eg - today I was unable to go long because there was divergence . Same case was for yesterday . Can you please guide .\U0001f64f pic.twitter.com/vfqy8dRAU2
— Mehul (@MehulGarodia9) May 20, 2022
More from Tcs


You May Also Like


I hate when I learn something new (to me) & stunning about the Jeff Epstein network (h/t MoodyKnowsNada.)
Where to begin?
So our new Secretary of State Anthony Blinken's stepfather, Samuel Pisar, was "longtime lawyer and confidant of...Robert Maxwell," Ghislaine Maxwell's Dad.
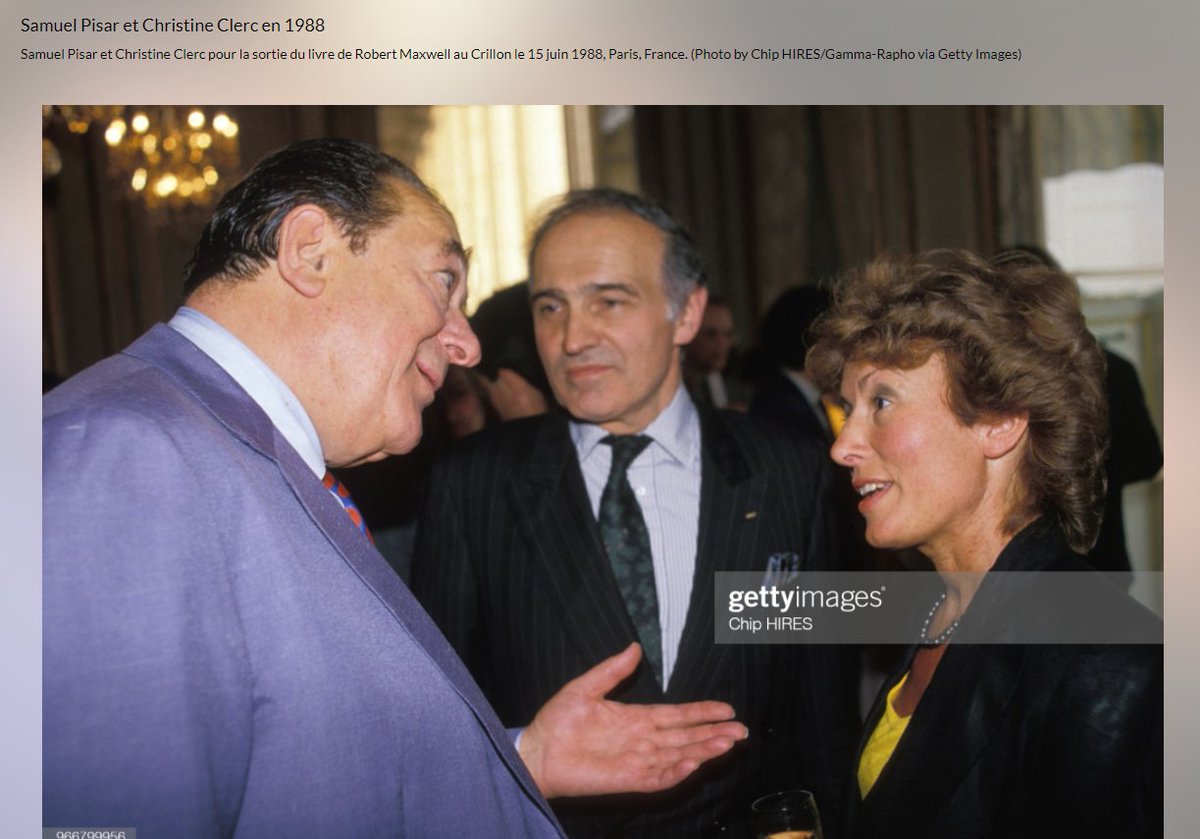
"Pisar was one of the last people to speak to Maxwell, by phone, probably an hour before the chairman of Mirror Group Newspapers fell off his luxury yacht the Lady Ghislaine on 5 November, 1991." https://t.co/DAEgchNyTP

OK, so that's just a coincidence. Moving on, Anthony Blinken "attended the prestigious Dalton School in New York City"...wait, what? https://t.co/DnE6AvHmJg
Dalton School...Dalton School...rings a
Oh that's right.
The dad of the U.S. Attorney General under both George W. Bush & Donald Trump, William Barr, was headmaster of the Dalton School.
Donald Barr was also quite a
I'm not going to even mention that Blinken's stepdad Sam Pisar's name was in Epstein's "black book."
Lots of names in that book. I mean, for example, Cuomo, Trump, Clinton, Prince Andrew, Bill Cosby, Woody Allen - all in that book, and their reputations are spotless.
Where to begin?
So our new Secretary of State Anthony Blinken's stepfather, Samuel Pisar, was "longtime lawyer and confidant of...Robert Maxwell," Ghislaine Maxwell's Dad.
"Pisar was one of the last people to speak to Maxwell, by phone, probably an hour before the chairman of Mirror Group Newspapers fell off his luxury yacht the Lady Ghislaine on 5 November, 1991." https://t.co/DAEgchNyTP
OK, so that's just a coincidence. Moving on, Anthony Blinken "attended the prestigious Dalton School in New York City"...wait, what? https://t.co/DnE6AvHmJg
Dalton School...Dalton School...rings a
Oh that's right.
The dad of the U.S. Attorney General under both George W. Bush & Donald Trump, William Barr, was headmaster of the Dalton School.
Donald Barr was also quite a
Donald Barr had a way with words. pic.twitter.com/JdRBwXPhJn
— Rudy Havenstein, listening to Nas all day. (@RudyHavenstein) September 17, 2020
I'm not going to even mention that Blinken's stepdad Sam Pisar's name was in Epstein's "black book."
Lots of names in that book. I mean, for example, Cuomo, Trump, Clinton, Prince Andrew, Bill Cosby, Woody Allen - all in that book, and their reputations are spotless.