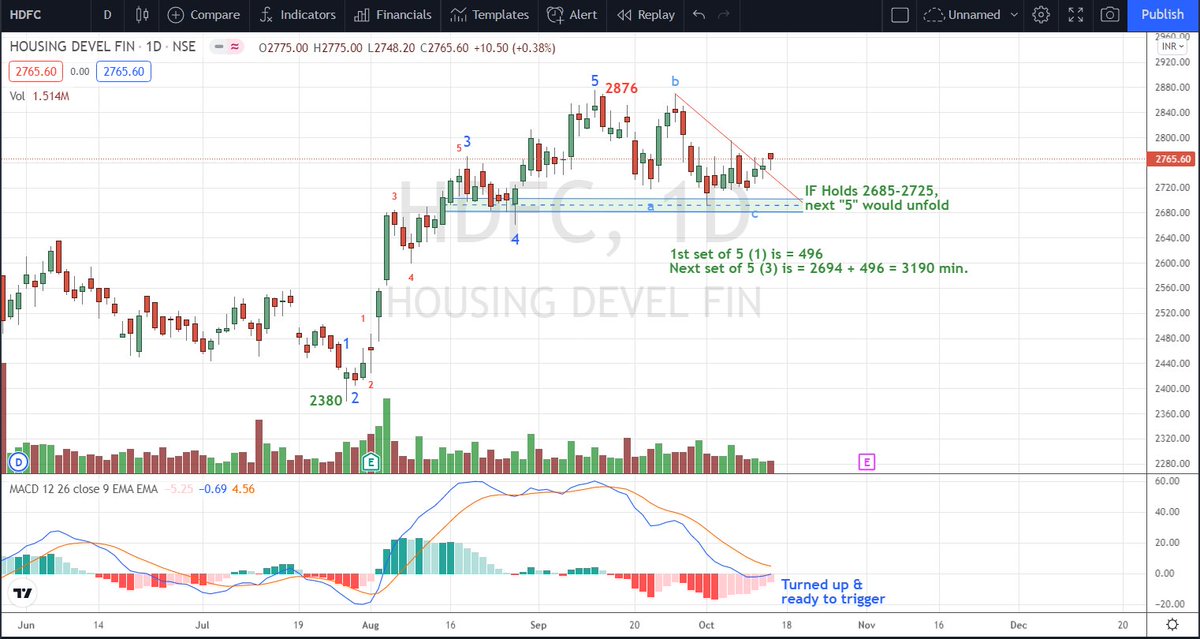
#Hdfc
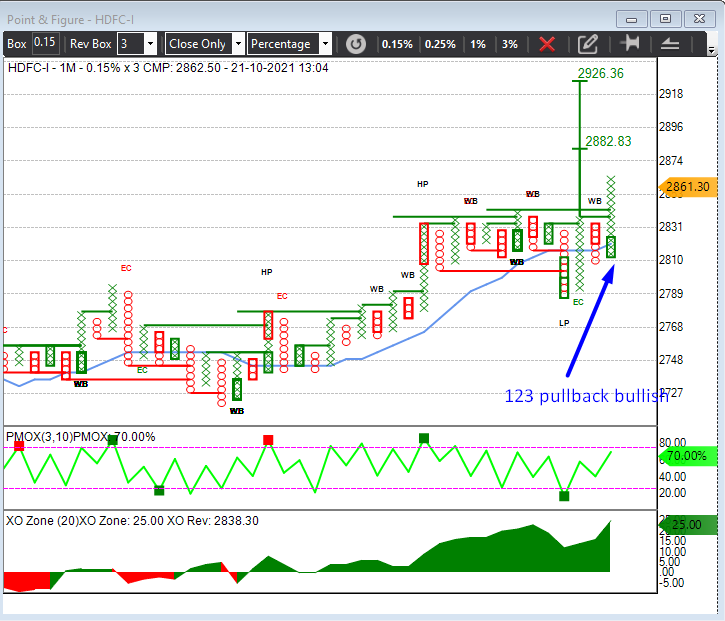
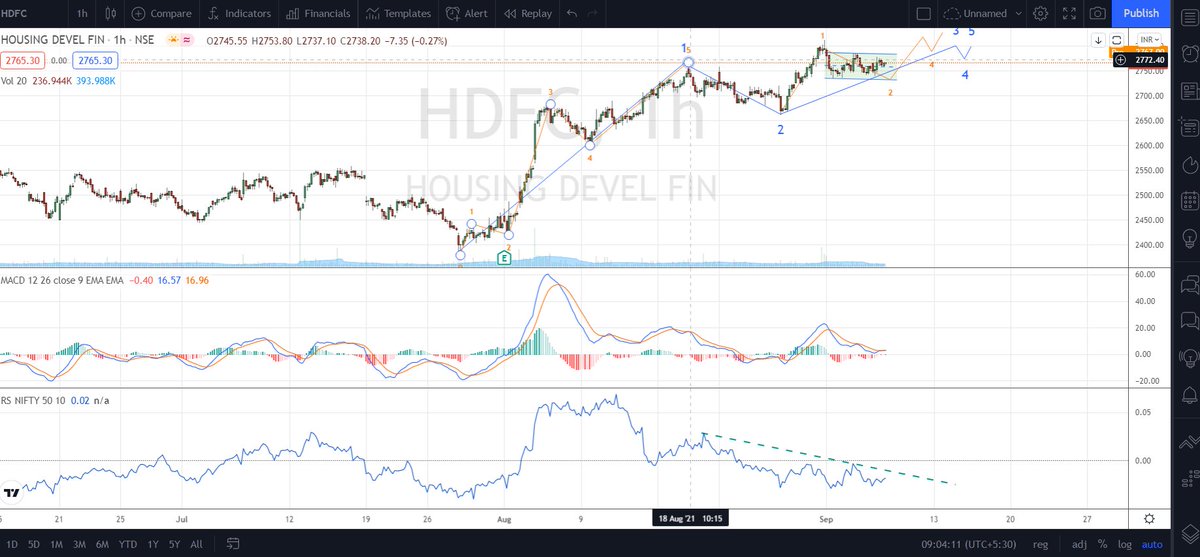
Very interestingly poised to make it's "iii"rd of 3rd wave, "Holding 2740-50".
Confirmation - moving past "2812"
More from Van Ilango (JustNifty)
#Hdfc (3190++)
#Hdfcbank (1724++)
#Reliance (2834++)
#ITC (274++) these are "just min. targets"
& many more would move up significantly
@rlnarayanan https://t.co/iVYE1F7l6v
#Nifty 3rd is sub-dividing as in chart:
— Van Ilango (JustNifty) (@JustNifty) October 13, 2021
[1]st: 16396 - 17793 = 1397
[2]nd: 17793-17948-17453 - Irregular flat
[3]rd: 17453+1397=18850 OR
: 17453+1928=19381 OR
: 17453+2096=19549 OR
: 17453+2260=19713 OR
Nothing wrong in projecting till holds "17990"
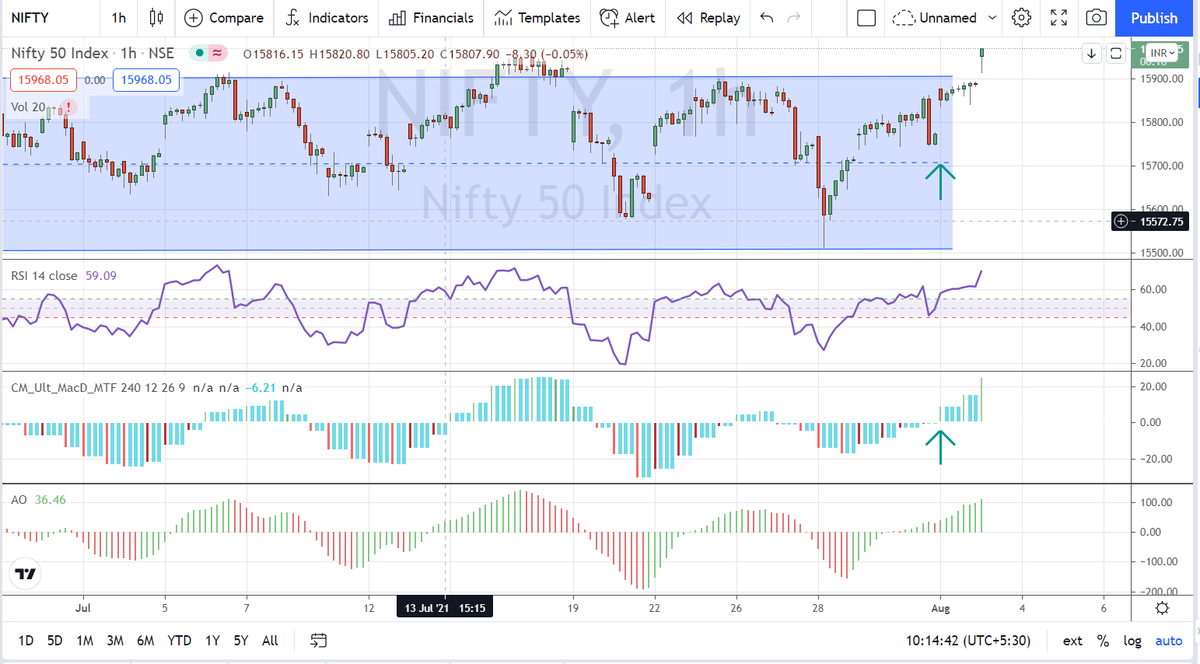
His simple mechanical system of MACD multi t/f with 4 Hour setting seems to remove whipsaws & is producing amazing result with #Nifty
Experience speaks - you listen and adopt
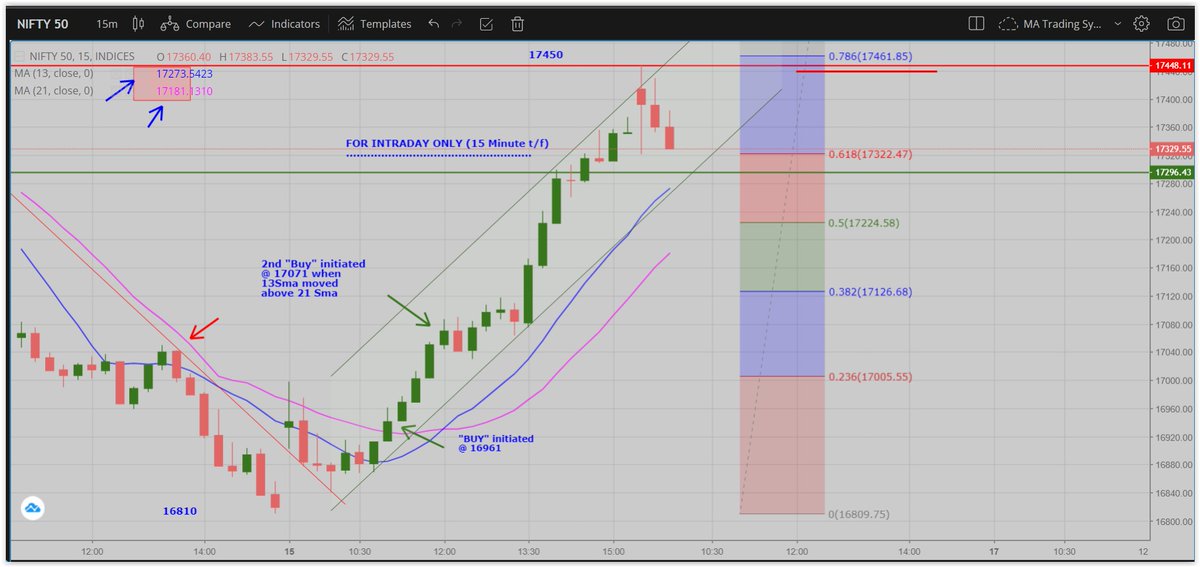
Develop patience to wait for such good set up. Now trail your SL once price has gains https://t.co/jC8tcrZ0Cv
Book mark this and revisit every day or every week till you get it right as a trader. Coming from an experienced trader like @MaverickAmit01 , it's priceless.
— Van Ilango (JustNifty) (@JustNifty) July 31, 2021
Wish we had it when we started out.\U0001f64f https://t.co/0NYKqedy9w




More from Hdfc


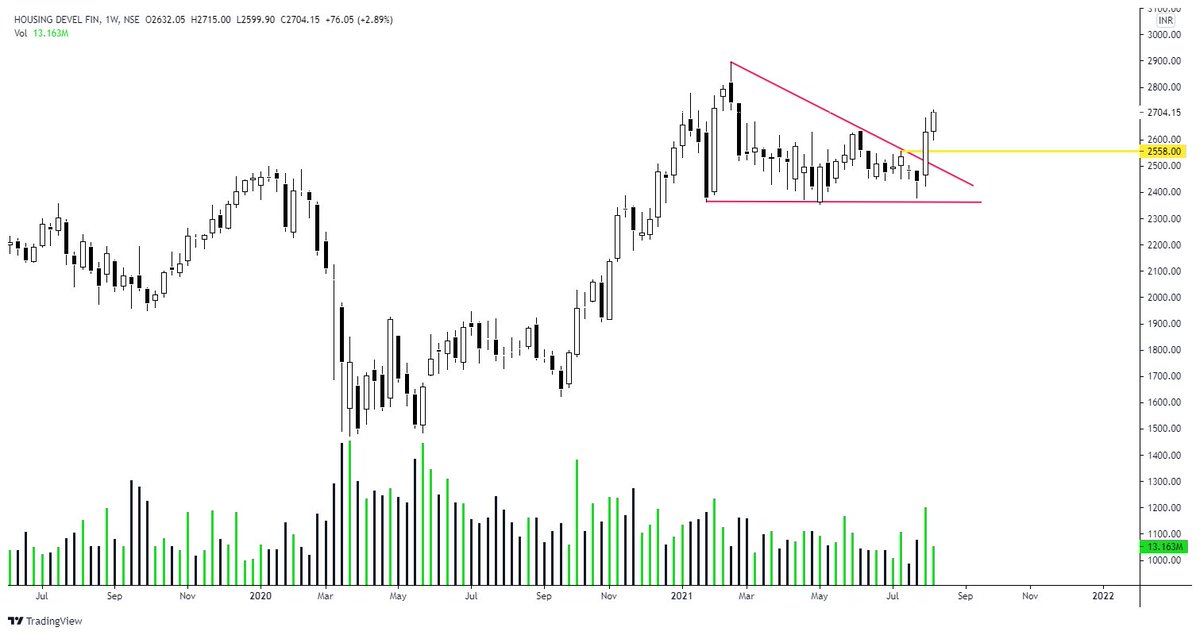
2715 📍
In Weekly; next in-line 2850.
In Monthly; Once ATH is taken out, A sight of 3000+ would be caught.
#StockMarket #StocksInFocus #HDFC https://t.co/VpM9Yvbq7l
#HDFC Daily and Weekly TF's
— Gurleen (@GurleenKaur_19) August 3, 2021
Broken past the descending trendline; A follow-up beyond '2558' would bring in 2630 initially followed by 2850.
In Monthly; Once ATH is taken out, A sight of 3000+ would be caught.
[Will open position above 2558]#StockMarket #StocksToWatch pic.twitter.com/jRukw5Yh6d