Jay_millerjay's Categories
Jay_millerjay's Authors


Latest Saves

a.k.a. the weirdest China tech story I’ve ever written 1/1
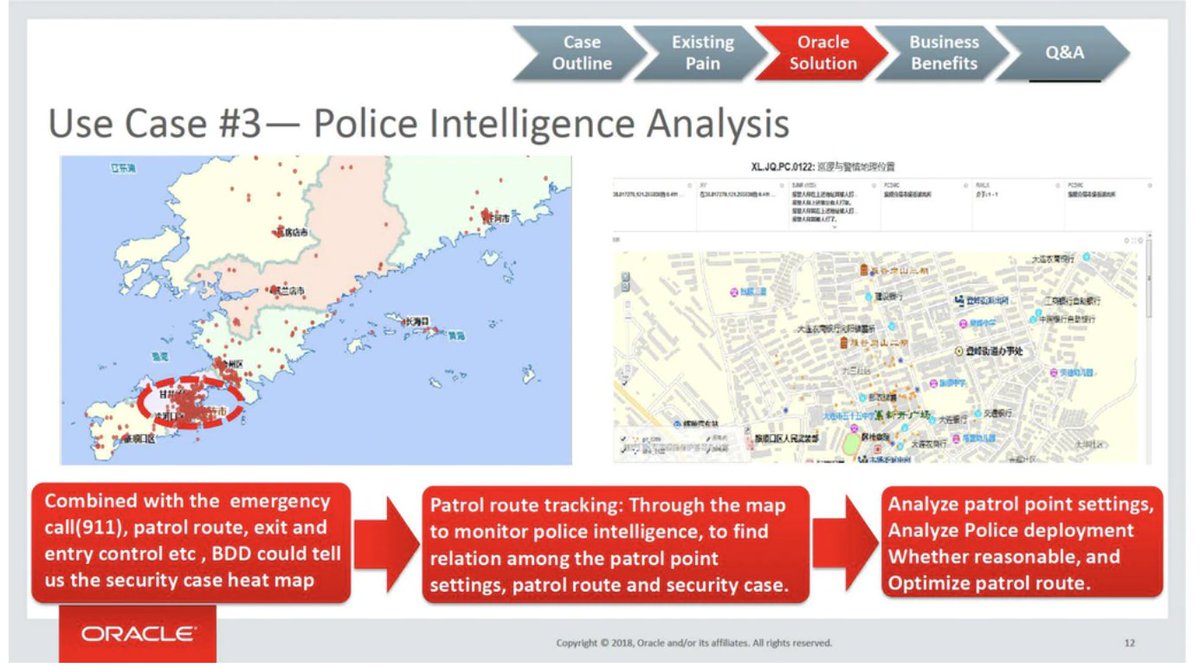
I found dozens of Oracle documents detailing how Chinese police can use the company's analytics software to mine databases containing DNA, vehicle records, facial recognition images, hotel registrations, and lists of drug users. 2/2
Oracle documents give detailed "use cases" that include screenshots of the software interface, suggesting that two provincial police departments (Liaoning and Shanxi) actually used Oracle tech to mine social and other data. One such case was presented at Oracle’s HQ in 2018. 3/3
Oracle has accused me of obtaining “Chinese domain” documents from one of their competitors, so let me be clear on where I found these documents: https://t.co/vavs1N8M9P, using a little search engine called Google. 4/4
Different employees authored the Oracle documents, but some are the work of a former Singaporean cop turned Oracle senior employee. For two years while at the company, his bios say that he was a visiting researcher at China’s leading policing academy. 5/5


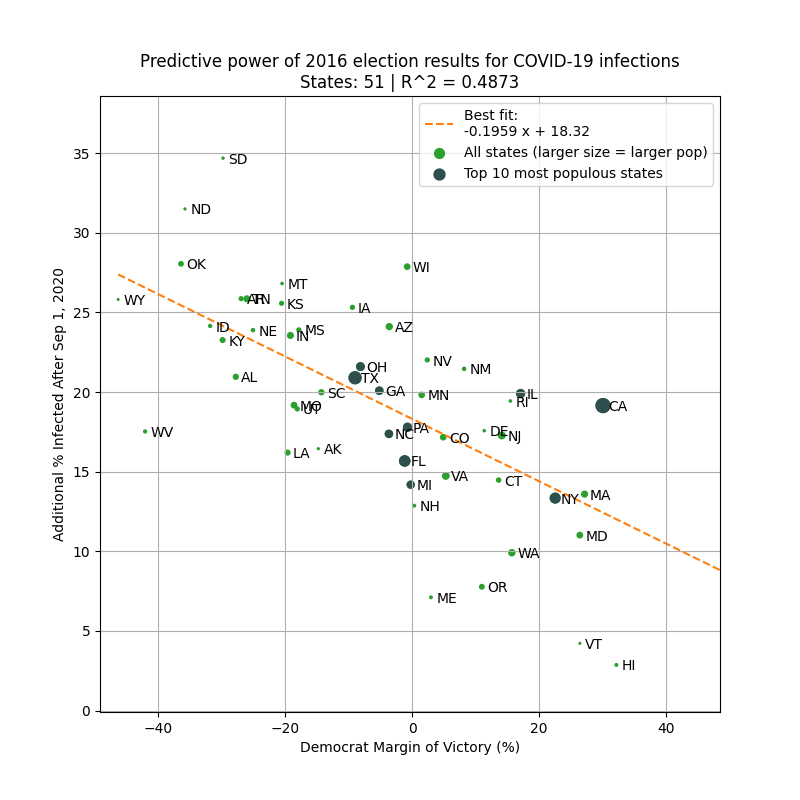
1) Margin of Democrat victory in Nov 2020 election
or
2) % infected through Sep 1, 2020
Can you guess which plot is which?

The left plot is based on the % infected through Sep 1, 2020. You can see that there is very little correlation with the % infected since Sep 1.
However, there is a *strong* correlation when using the margin of Biden's victory (right).
Infections % from https://t.co/WcXlfxv3Ah.

This is the strongest single variable I've seen in being able to explain the severity of this most recent wave in each state.
Not past infections / existing immunity, population density, racial makeup, latitude / weather / humidity, etc.
But political lean.
One can argue that states that lean Democrat are more likely to implement restrictions/mandates.
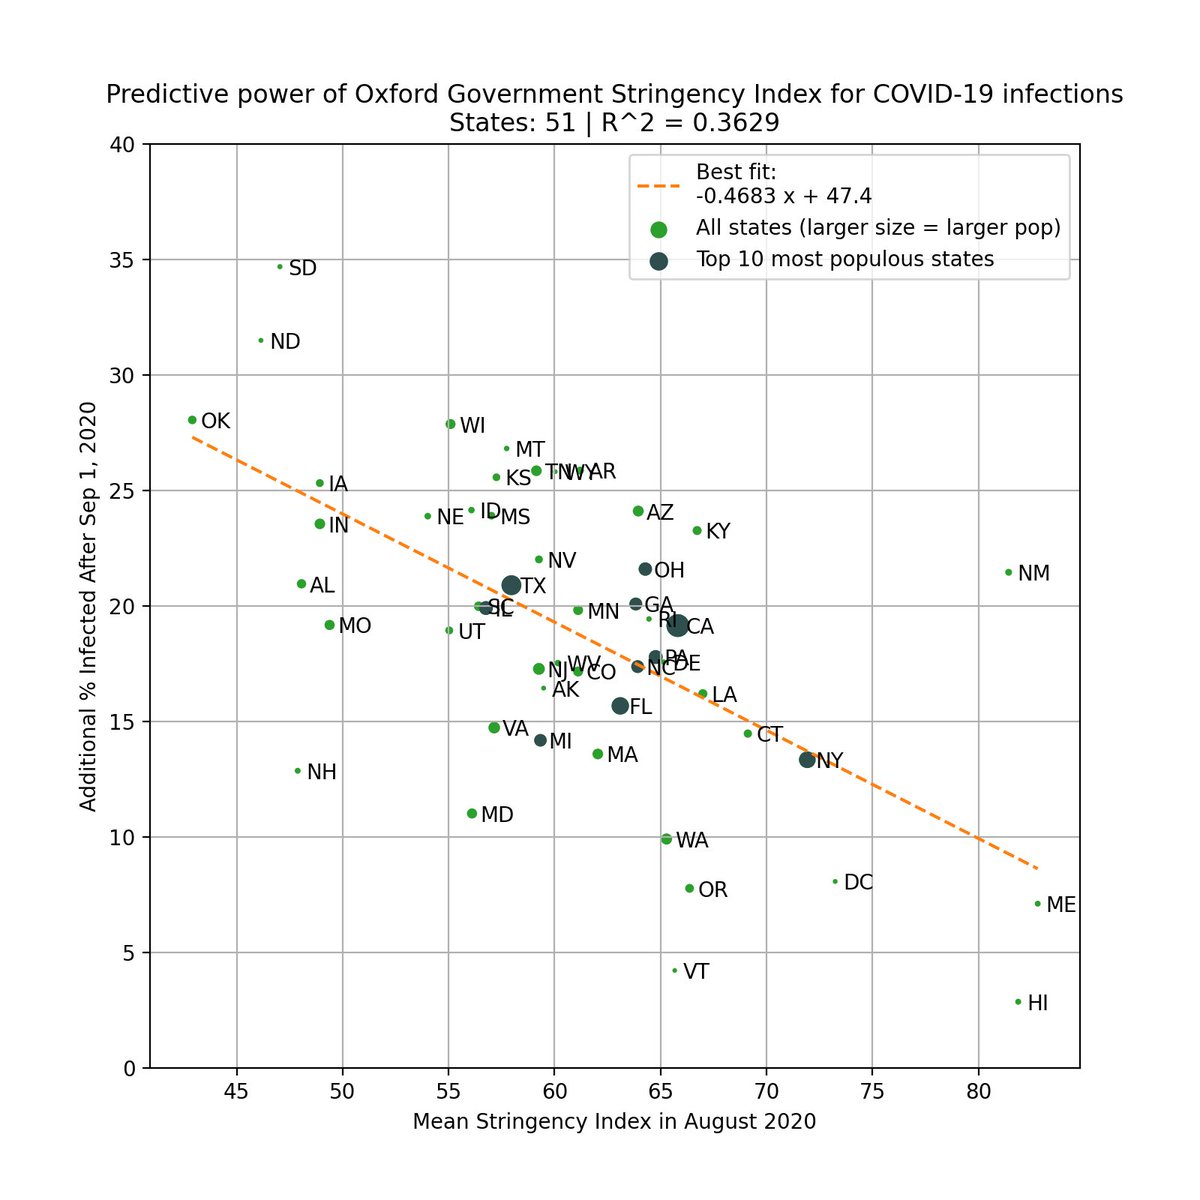
This is valid, so we test this by using the Government Stringency Index made by @UniofOxford.
We also see a correlation, but it's weaker (R^2=0.36 vs 0.50).
https://t.co/BxBBKwW6ta
To avoid look-ahead bias/confounding variables, here is the same analysis but using 2016 margin of victory as the predictor. Similar results.
This basically says that 2016 election results is a better predictor of the severity of the fall wave than intervention levels in 2020!


[A quick thread]
So yesterday I sold two of my holdings that I didn't like very much for the following
Risk reduction in the case of DataDog. I have too many holdings in a similar space. GoodRx's business model doesn't entice me as much as I would like it to. Ultimately, it was to free up some cash in the event that a significant dip comes along. I like to keep 10% in free cash.
— That Pragmatic Guy (@MpiloGMangali) February 16, 2021
I know what you thinking: "smart move! 😎"
Will I be going on a buying frenzy today? Not quite. I think I'll sit today out. I've had some great lessons about the dip that I'd like to share with you.
I came across this fortune teller on YouTube who could predict pullbacks.
If this guy is anything to go by, we may have a sale on our hands next week. Do you have:
— That Pragmatic Guy (@MpiloGMangali) October 21, 2020
a) Free cash available, and
b) Wishlist of holdings you want to add to? pic.twitter.com/ASCrGy3H71
Of course I thought to myself, I'm going to be smart about this and decided to split my money over the full week because no one can predict the bottom. However, this
I'm not okay. I've been buying stocks bit by bit since Monday and by Tuesday I got greedy and decided to split my money to last me until yesterday. Today, the market is even lower.
— That Pragmatic Guy (@MpiloGMangali) October 30, 2020
I deviated from my original plan to split my money over the full week and it cost me. pic.twitter.com/1kcRgvj5H3


