First up Xilinx
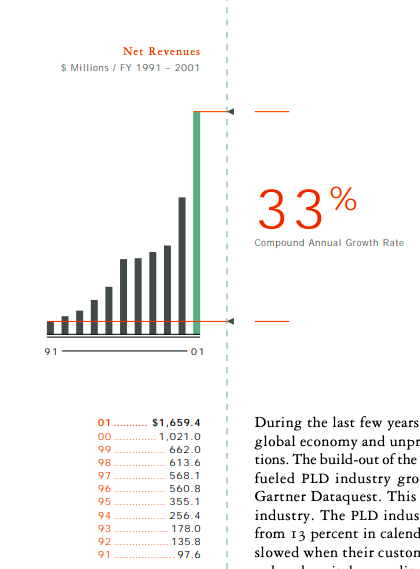
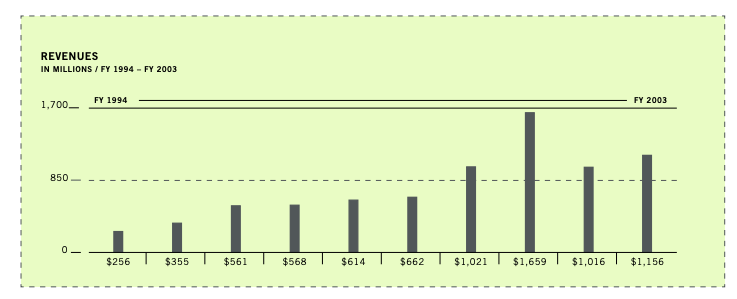
They were the leaders (and still are) with ~40% share in FPGAs. The end market was growing. They were growing fast as shown in this chart for fiscal year 2001 ending in March 2001
The CAGR was lot higher in closer to 2000 - it was growing 50%+. Until 2001 that is. That's when revenues dropped 30% due to market correction.
Xilinx - an innovator and leader in FPGAs - did not reach same stock price until 2018!
Next up - Microsoft
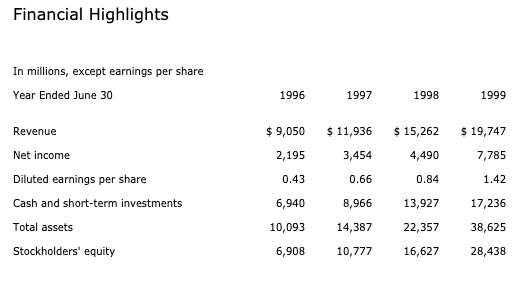
It was growing fast, Bill Gates was talking of PC plus era where internet would enable new features
But MSFT got multiple compression problem as covered in this excellent tweet from
@corry_wang Stock price to dropped from the highs of late 1999 and didn't get back till 2016, despite quadrupling earnings in the next decade
https://t.co/LE0QfsVzFL
Sure we can see what the problem was in hindsight, but sitting there in 1999, it was hard to see how MSFT won't do great. And they did great as a biz, but the stock didn't due to multiple compression
Next is Cisco. The story line in 1999 was:
* They were powering the internet
* they were the tech leaders
* they had top 10 market cap in the world
* growing close to 50% per year
* John Chambers was widely praised as CEO, Don Valentine (of Sequoia) was Vice Chairman of board
Over the next decade (2000-2010), Cisco sales grew 3x and net income grew 7x
And yet stock price never got back to the high of 2000.
1999 high for Cisco was $67 stock price.
P/S was ~ 19
P/E was ~ 110
(1999 annual report is so dreamy -
https://t.co/SVUOCNJDoo)
Then there was the telecom bubble with terrible unit economics.
https://t.co/oDcXW8Zzi5
Even the mighty Amazon dropped 90%.
@MIcapital2 does a great job explaining how AMZN stock traded at 14x NTM revenue. But growth slowed from 170% in 1999 to 60% in 2000 along with negative cash flow, and stock dropped ~90%
https://t.co/rpoqYpwTwh
Related to telecom bubble was the optical tech company of JDS Uniphase - a combination of optical potential & roll up of several companies. Fast growth (JDS grew 50%, Uniphase 100%)
Their 1999 AR explains the merger logic and makes it seem like a "platform" play.
JDSU in 2000 grew to $1.4B revenue - almost 3x that of 1999. Impossible to tell how much organic vs, thru acquisitions. But just look at that alphabet soup of acquired companies
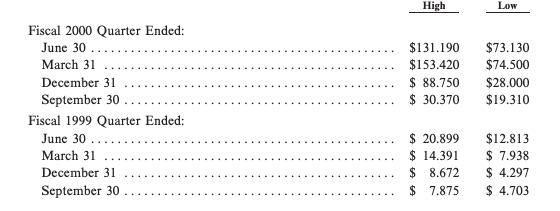
JDSU grew to $100B market cap and acquired a company called SDL for $41B in stock. Look the first pic for stock price craziness
JDSU - There was overcapacity and overbuilding in telecom networks though. So revenues just dropped after 2001, dropping 80% from 2001 to 2003
And the stock round tripped and dropped some more. Terrible for people who got in at the high price for JDSU
JDSU is a curious case - the revenue growth was real and explosive (~$300M to $3B in 3 years thru organic growth + M&A). But what about "Quality" of revenue?
How likely was that growth to continue?
Most investors probably had no clue on telecom capacity overbuilding.
And then there's Yahoo - classic case of valuation for eyeballs, but also a phenomenal growth story before the stock crash.
@ChrisBloomstran does amazing job explaining what happened with Yahoo. Just pasting the Yahoo piece because I don't want to get caught in Tesla stock fight
Yahoo grew sales by 88% in 2000, yet stock price dropped 96%.
Because P/S dropped from 211 to 15!
Ending this long thread with some open-ended questions to ponder upon:
1. which of today's stocks might have too high of a multiple that could get compressed (despite continuing growth)?
2. Where is revenue "quality" low and current growth or high level of revenue may not hold?
PS: for question #2 above, it should read as quality is lower than expectations.
PPS: Xilinx did not reach 2001 revenues again till 2006.
(2000 to 2001 growth was 63%!)
Shows how hard it's to predict growth rates.
Stock price went up to 2001 levels in 2018 when revenues were 50% higher than 2001 and net income was 30% higher.