1/ How to review quarterly earnings đź§µ

A step by step guide using $DXCM as an example

⬇️

2/ The BIG question: Is the thesis on trackâť“

Other question:

❓Is revenue growing?
❓Are margins stable/expanding?
❓Profits?
❓Balance sheet?
❓New opportunities?
❓New threats?

3/ I open 4 browser tabs

Tab 1 - Current company earnings report / shareholder letter

Tab 2 - Previous company earnings report / shareholder letter (check guidance)

Tab 3 - Analyst estimates

Tab 4 - Call Transcript
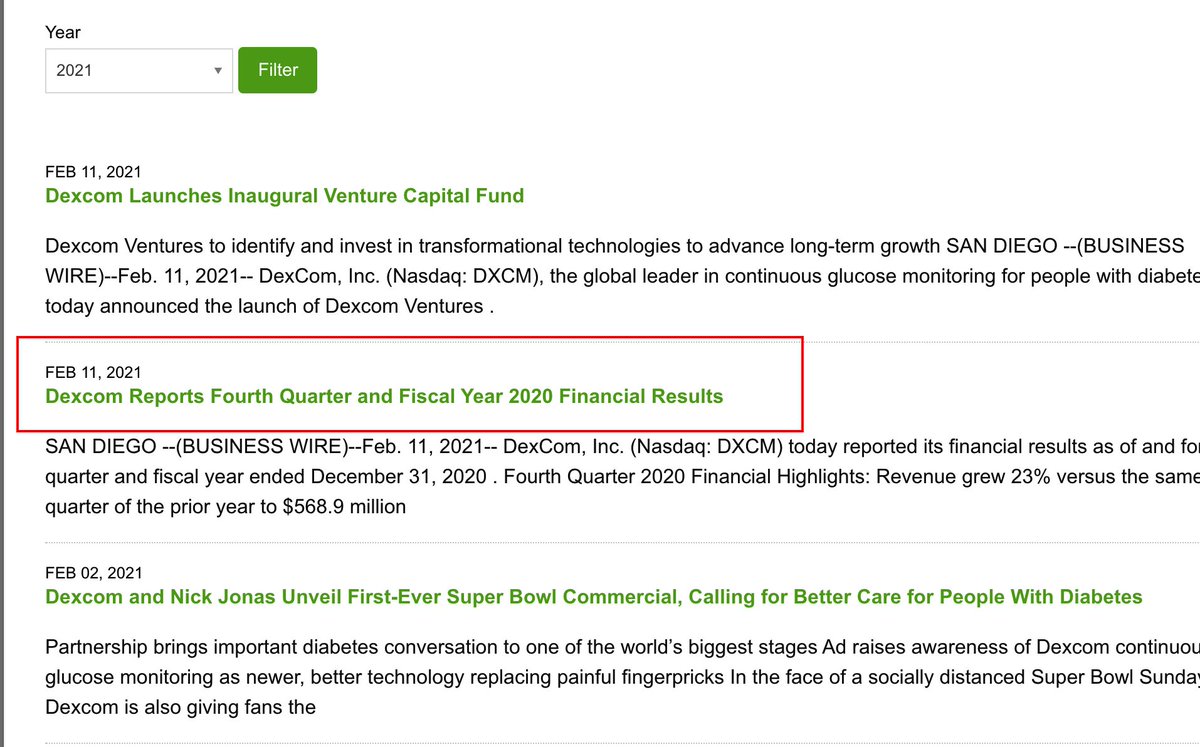
4/ Tabs 1 & 2 - Find the current & previous earnings report

I search "Dexcom Investor Relations"

I click on "press release"

Open the newest quarterly earnings report and last quarter

It can also be a shareholder letter/presentation
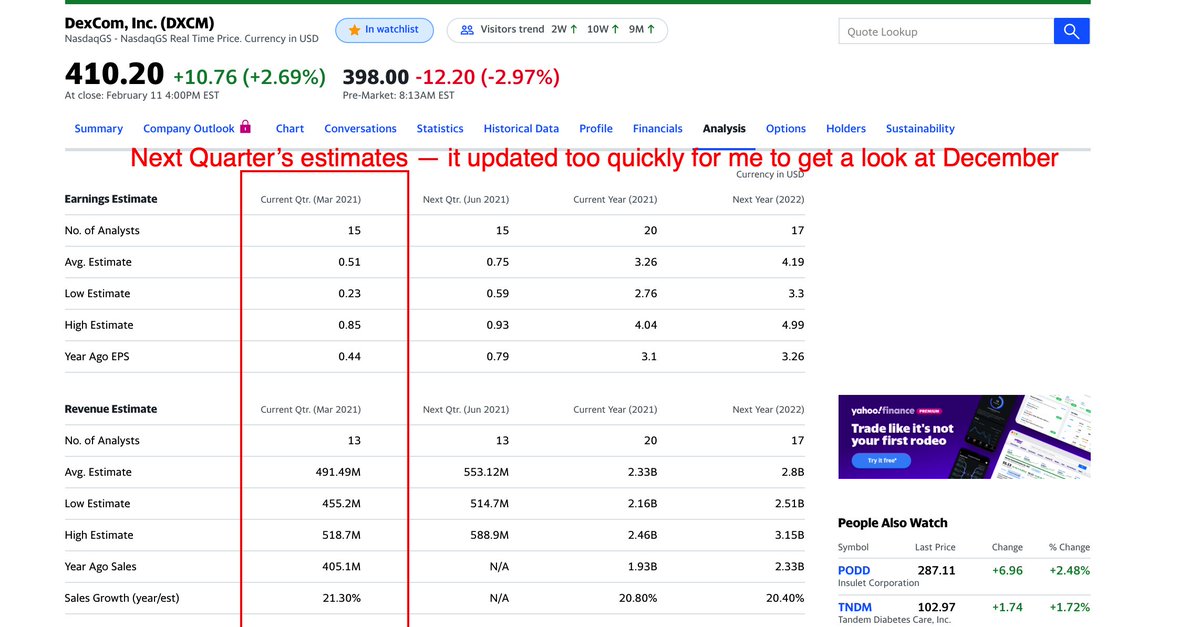
5/ Tab 3 - Find the quarterly analyst estimates

Open up $DXCM in yahoo finance

The "news" section usually has a link to reports on whether the company beat/met estimates

The "analysis" tab is a good source, but sometimes it updates to the next quarter too quickly
6/ Tab 4 - Find a transcript of the earnings call

@themotleyfool transcripts are best

Sometimes links are on Yahoo Finance news

Search "Fool DXCM Transcript" if not

Seekingalpha / NASDAQ are two other free sources
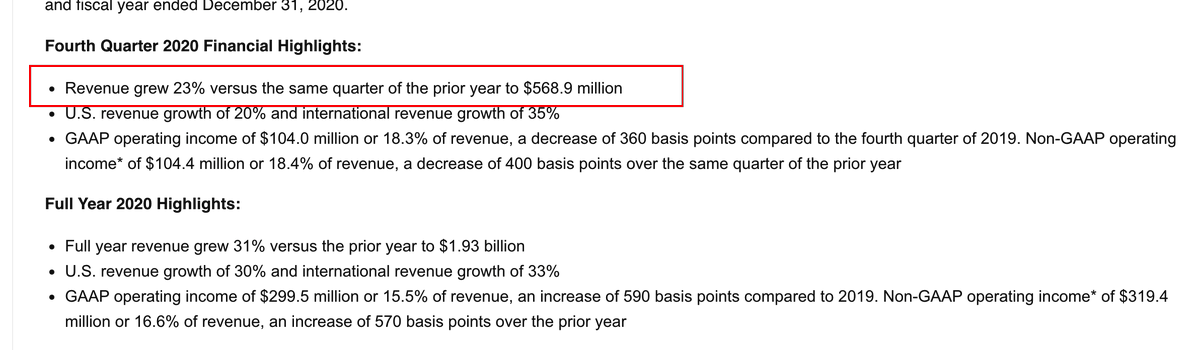
7/ In most recent earnings, I check the headline numbers:

Revenue growth: 23% to $569 million
Revenue vs. Wall Street expectations (beat by 1.88%)âś…

non-gaap EPS growth: -21% to $0.91

EPS vs. Wall Street expectations (meet expectation)âś…
8/ Results vs. guidance

Management issued yearly guidance for 2020 in Q3 2020

Revenue +29% to $1.9 billion (actual +31% to $1.93 billion)âś…

Non-GAAP Gross margin 66% (actual 66.7%)âś…

Non-GAAP Operating margin 16% (actual 16.5%)âś…
9/ Balance Sheet

$2.71 billion cash

$1.67 billion long-term convertible notes
10/

Margins

Use transcript / press release / or calculate yourself

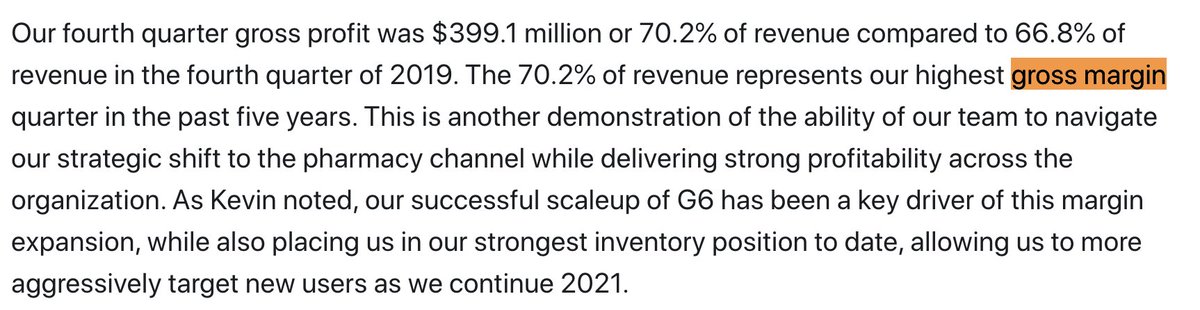
Gross 70.2% vs. 66.8% (gross profit grew faster than revenue)

Non-gaap Operating: 18.3% vs. 22.5% (investigate!)

non-gaap Net: 15.8% vs. 22.9% (investigate!)
11/

News from press release?

âś…Building out salesforce (explains operating margin & net margin drop)

âś…Reimbursement in France
12/

Read through transcript:

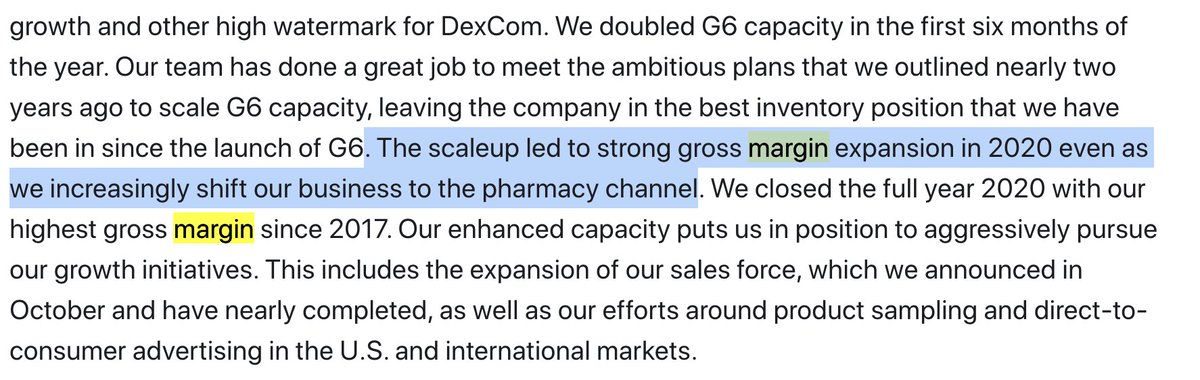
✅Gross margin ⬆️ from new manufacturing facility

âś…Super bowl commerical

âś…New service center in Lithuania

âś…New manufacturing site in Malaysia

âś…New sensor launching in 2nd half 2021

âś…Enter VC space
13/ Transcript

âś…50% of sales now coming through pharmacy

âś…International sales 35% of revenue

âś…International DTC campaign launching
14/

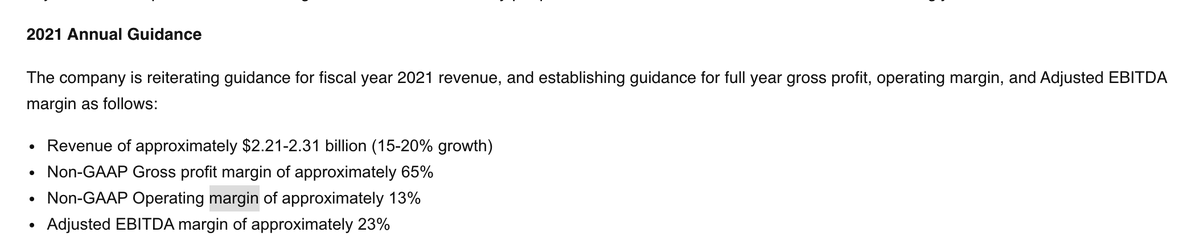
2021 Guidance:

Revenue:
Management expects 15% to 20% growth

Wall Street expects 21%

Margins:
Gross ⬇️ to 65%
Operating ⬇️ 13%
15/

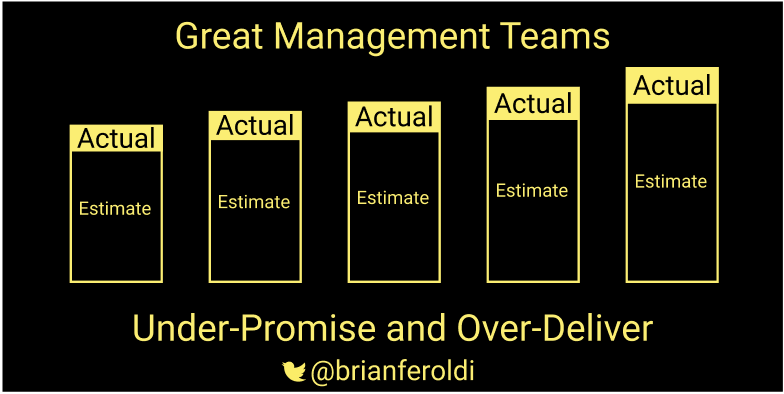
Management has a long history of under-promising & over-delivering, so I view these numbers as the floor, not the ceiling
16/

My big takeaways:

âś…Revenue growing
âś…Gross margin expanding
âś…International expansion
âś…Reinvestment year causing bottom-line to look worse
🛑2021 Margins will be weak
âś…Move to pharmacy working
âś…G7 launching in 2021
âś…VC fund adds optionality

THESIS ON TRACK
17/

If you own $DXCM, the best move is to continue to do nothing
18/

Best guess is that $DXCM is in the top of the 5th inning of its growth cycle
19/ I email financial graphics like these every day for free

Interested?

https://t.co/SjeNPpNAHN

More from Brian Feroldi

Last week, I asked my followers to share their favorite Twitter threads

I receive tons of wonderful replies and read through them all

Here are 31 amazing threads that are well worth your time ⬇️

1/ @10kdiver on


2/ @aaronbush100 on 20 semi-controversial investing


3/ @annieduke on category


4/ @awilkinson on losing

More from Trading

TradingView isn't just charts

It's much more powerful than you think

9 things TradingView can do, you'll wish you knew yesterday: đź§µ

Collaborated with @niki_poojary

1/ Free Multi Timeframe Analysis

Step 1. Download Vivaldi Browser

Step 2. Login to trading view

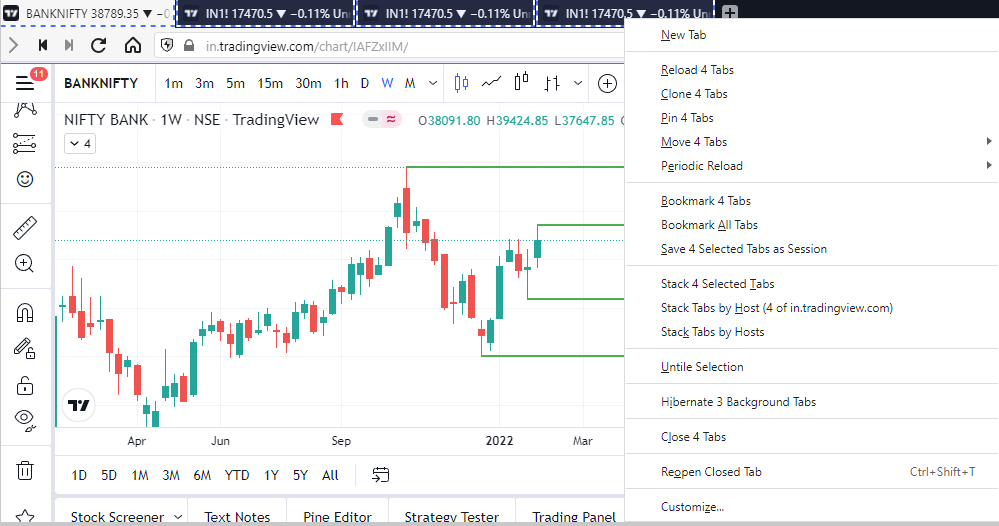
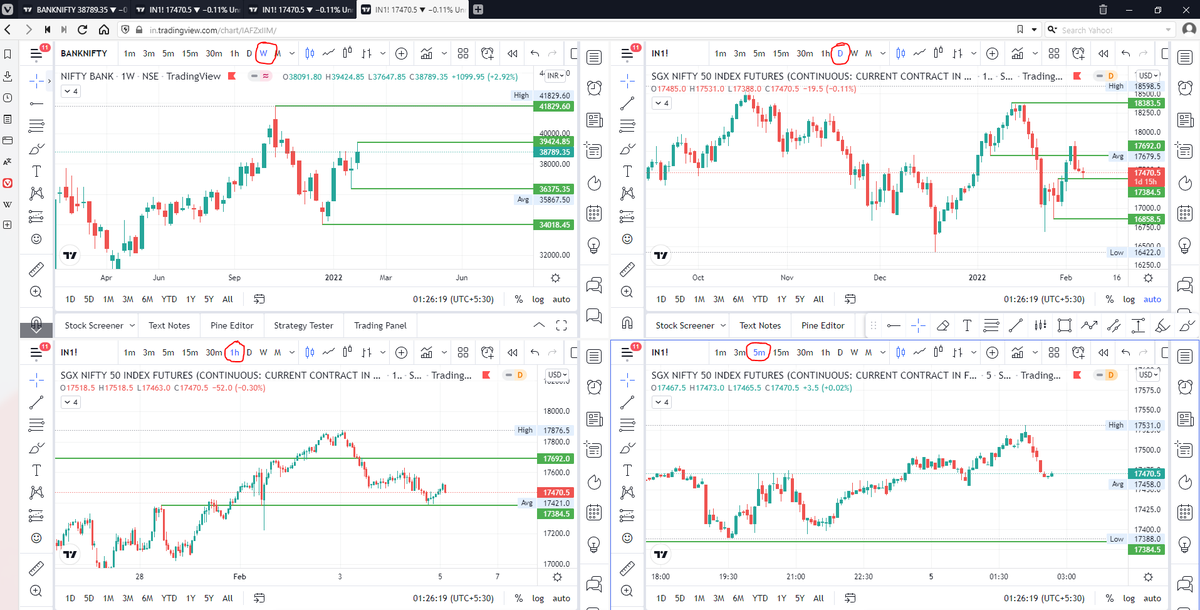
Step 3. Open bank nifty chart in 4 separate windows

Step 4. Click on the first tab and shift + click by mouse on the last tab.

Step 5. Select "Tile all 4 tabs"


What happens is you get 4 charts joint on one screen.

Refer to the attached picture.

The best part about this is this is absolutely free to do.

Also, do note:

I do not have the paid version of trading view.


2/ Free Multiple Watchlists

Go through this informative thread where @sarosijghosh teaches you how to create multiple free watchlists in the free


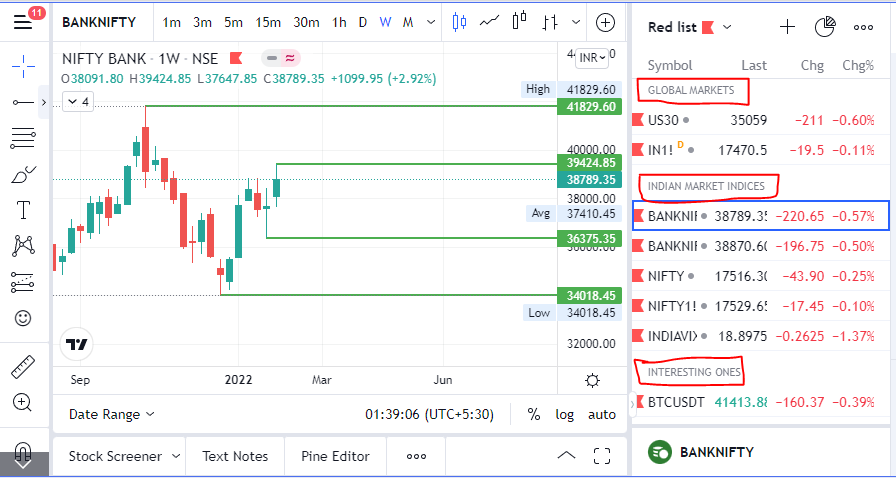
3/ Free Segregation into different headers/sectors

You can create multiple sections sector-wise for free.

1. Long tap on any index/stock and click on "Add section above."
2. Secgregate the stocks/indices based on where they belong.

Kinda like how I did in the picture below.

You May Also Like