It's all an artificial construct. Which is fine, as long as we stop pretending it's an objective marketplace governed by natural law.
The stock market is not a neutral arbiter of real value.
The stock market is not a neutral arbiter of real value.
The stock market is not a neutral arbiter of real value.
The stock market is not a neutral arbiter of real value.
The stock market is not...
It's all an artificial construct. Which is fine, as long as we stop pretending it's an objective marketplace governed by natural law.
Citigroup doesn't get to decide who lives and who dies.
And now they're freaking out if we literally start deciding it with our *money* in their "free" market.
They don't get to decide! /3
If the rules were fairly and equally applied, Goldman Sachs and Citigroup would be bankrupt and stripped to the bone. /4
But they're no different from Redditors. /5
It's all propped up. So why shouldn't we do some propping? /6
We, as voters, should be doing a lot more intervention to decide what we think is truly valuable and worth protecting. Instead of protecting hedge funds and letting *them* decide for profit. /end
More from Trading


TradingView isn't just charts
It's much more powerful than you think
9 things TradingView can do, you'll wish you knew yesterday: 🧵
Collaborated with @niki_poojary
1/ Free Multi Timeframe Analysis
Step 1. Download Vivaldi Browser
Step 2. Login to trading view
Step 3. Open bank nifty chart in 4 separate windows
Step 4. Click on the first tab and shift + click by mouse on the last tab.
Step 5. Select "Tile all 4 tabs"
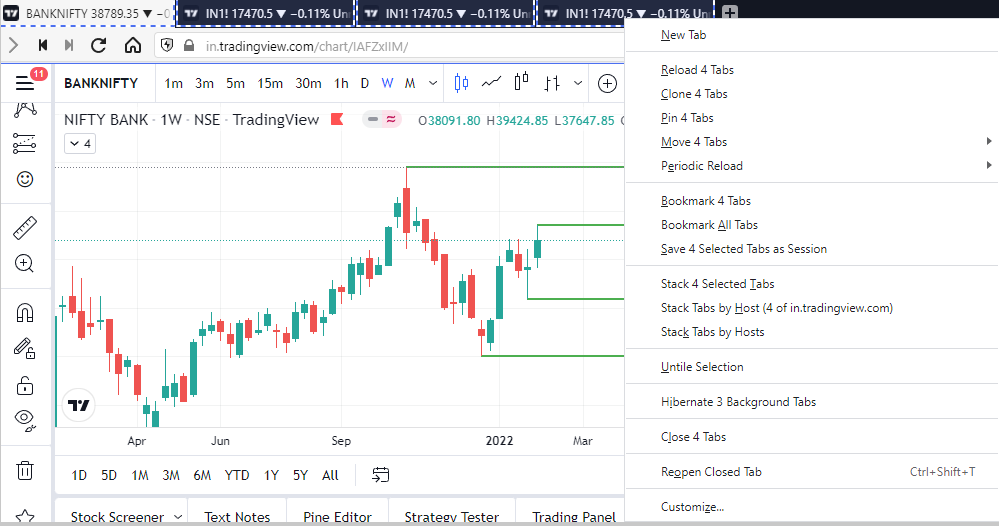
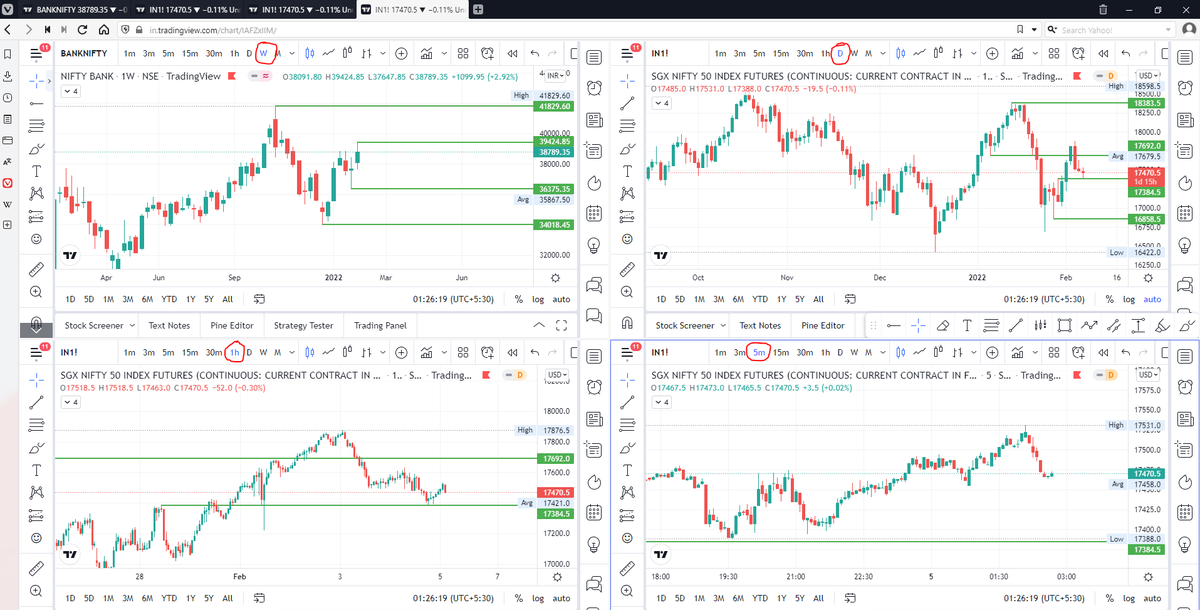
What happens is you get 4 charts joint on one screen.
Refer to the attached picture.
The best part about this is this is absolutely free to do.
Also, do note:
I do not have the paid version of trading view.
2/ Free Multiple Watchlists
Go through this informative thread where @sarosijghosh teaches you how to create multiple free watchlists in the free
3/ Free Segregation into different headers/sectors
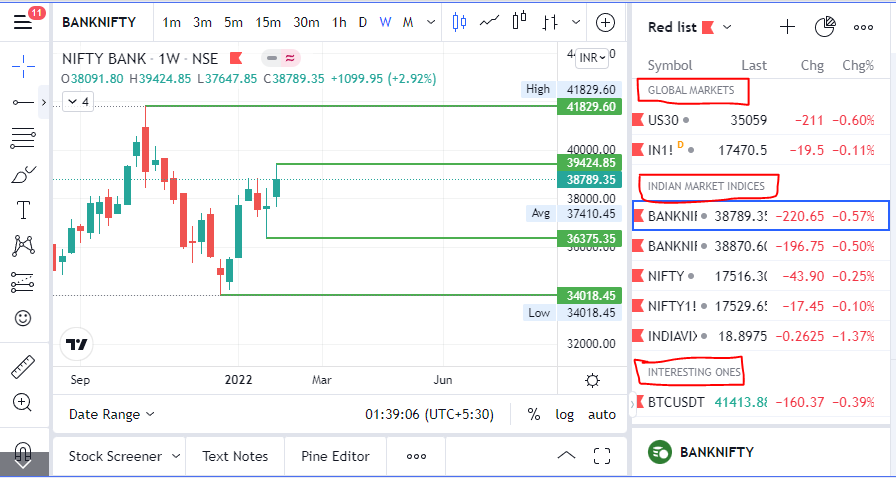
You can create multiple sections sector-wise for free.
1. Long tap on any index/stock and click on "Add section above."
2. Secgregate the stocks/indices based on where they belong.
Kinda like how I did in the picture below.
It's much more powerful than you think
9 things TradingView can do, you'll wish you knew yesterday: 🧵
Collaborated with @niki_poojary
1/ Free Multi Timeframe Analysis
Step 1. Download Vivaldi Browser
Step 2. Login to trading view
Step 3. Open bank nifty chart in 4 separate windows
Step 4. Click on the first tab and shift + click by mouse on the last tab.
Step 5. Select "Tile all 4 tabs"
What happens is you get 4 charts joint on one screen.
Refer to the attached picture.
The best part about this is this is absolutely free to do.
Also, do note:
I do not have the paid version of trading view.
2/ Free Multiple Watchlists
Go through this informative thread where @sarosijghosh teaches you how to create multiple free watchlists in the free
\U0001d5e0\U0001d602\U0001d5f9\U0001d601\U0001d5f6\U0001d5fd\U0001d5f9\U0001d5f2 \U0001d600\U0001d5f2\U0001d5f0\U0001d601\U0001d5fc\U0001d5ff \U0001d604\U0001d5ee\U0001d601\U0001d5f0\U0001d5f5\U0001d5f9\U0001d5f6\U0001d600\U0001d601 \U0001d5fc\U0001d5fb \U0001d5e7\U0001d5ff\U0001d5ee\U0001d5f1\U0001d5f6\U0001d5fb\U0001d5f4\U0001d603\U0001d5f6\U0001d5f2\U0001d604 \U0001d602\U0001d600\U0001d5f6\U0001d5fb\U0001d5f4 \U0001d601\U0001d5f5\U0001d5f2 \U0001d5d9\U0001d5e5\U0001d5d8\U0001d5d8 \U0001d603\U0001d5f2\U0001d5ff\U0001d600\U0001d5f6\U0001d5fc\U0001d5fb!
— Sarosij Ghosh (@sarosijghosh) September 18, 2021
A THREAD \U0001f9f5
Please Like and Re-Tweet. It took a lot of effort to put this together. #StockMarket #TradingView #trading #watchlist #Nifty500 #stockstowatch
3/ Free Segregation into different headers/sectors
You can create multiple sections sector-wise for free.
1. Long tap on any index/stock and click on "Add section above."
2. Secgregate the stocks/indices based on where they belong.
Kinda like how I did in the picture below.




A thread on getting intraday (any timeframe) data to excel without any coding. Limited to only last 60 days. Fetches from zerodha chart.
👇
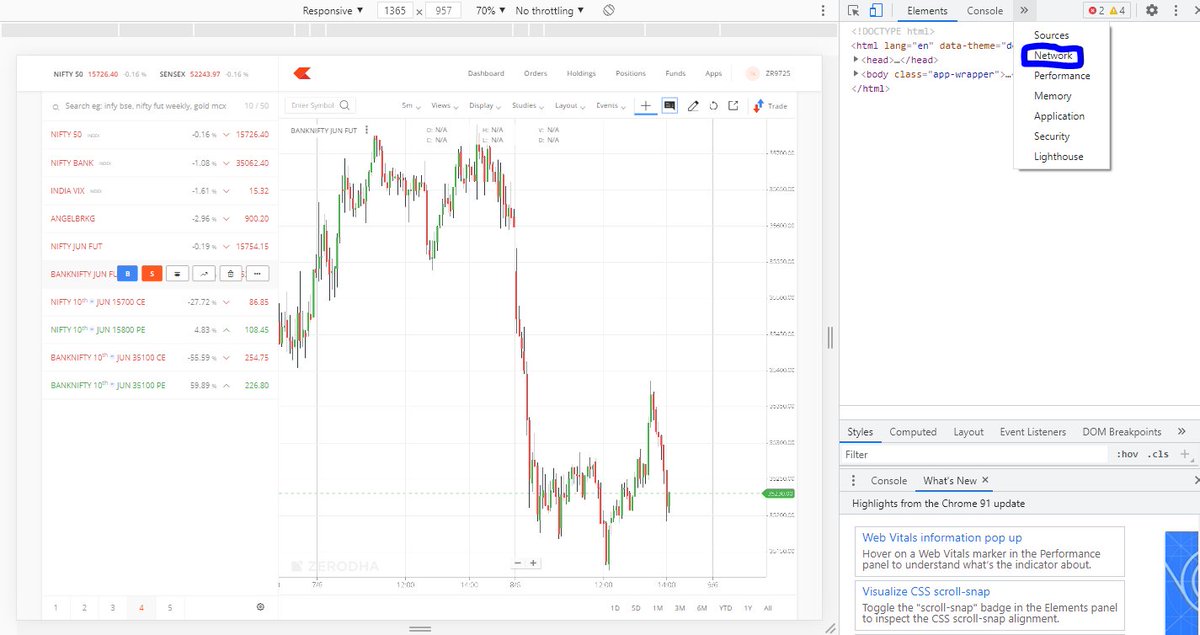
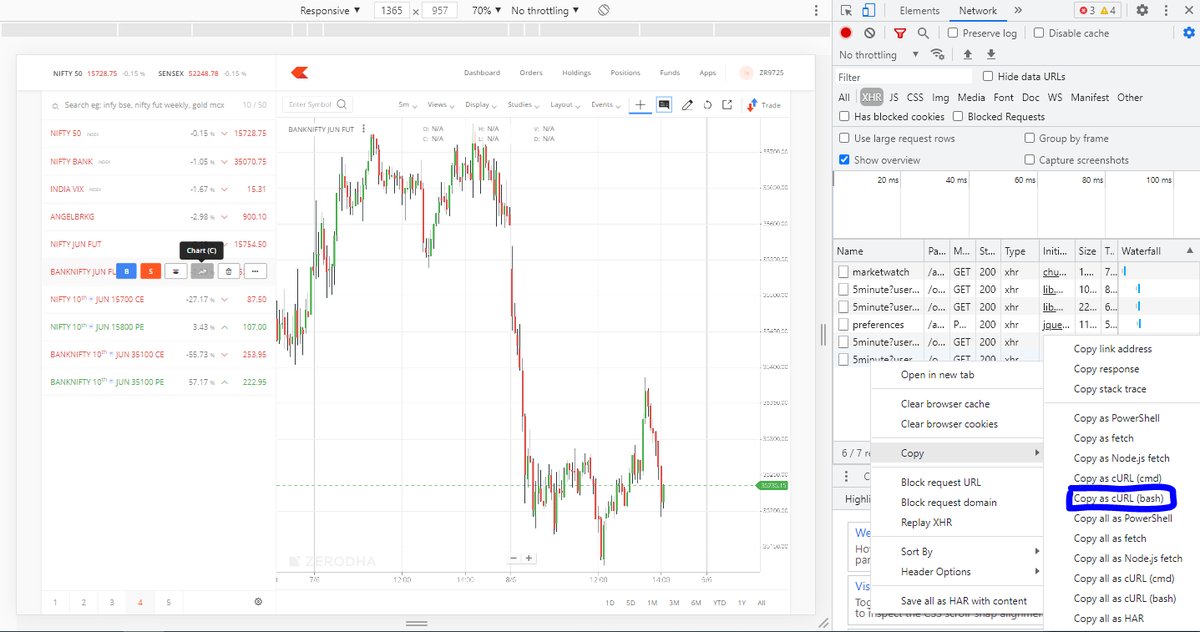
1. Open the chart on zerodha web in chrome. Right click and select 'Inspect'. Click 'Network' as shown in this pic.
2. Right click on the last entry on the table you see and click 'copy as cURL (bash)'
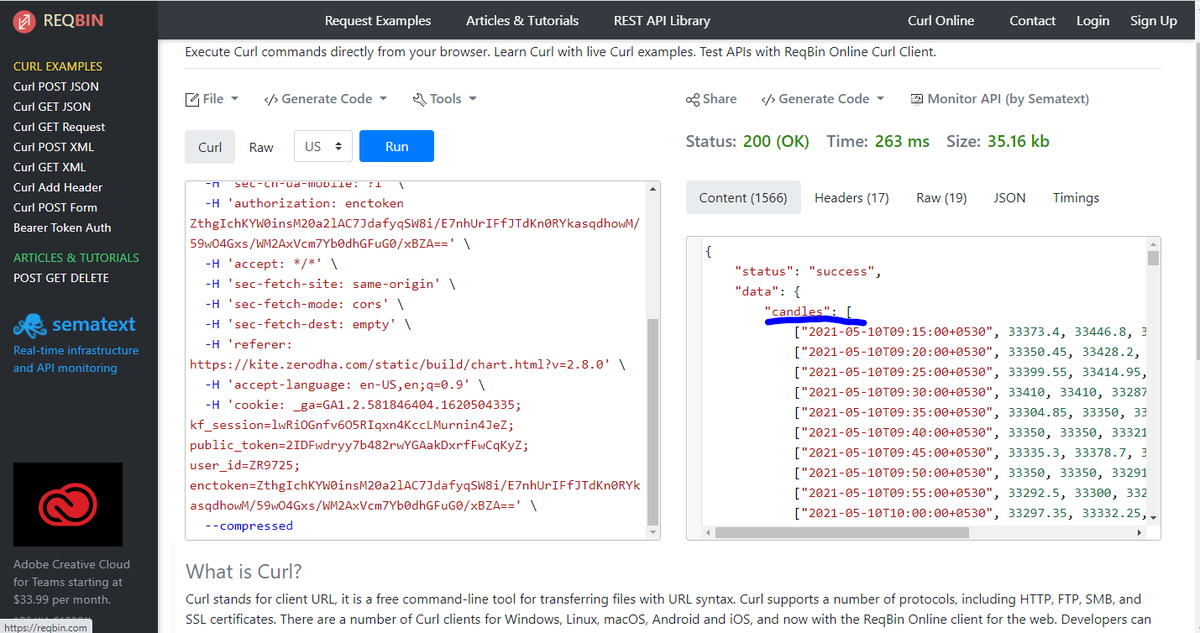
3. Go to website https://t.co/f8rhwoGLUc and paste on the left box and click 'Run'
4. The output below candles written on right of box is the ohlc, volume and oi data. Copy and paste to excel.
👇
1. Open the chart on zerodha web in chrome. Right click and select 'Inspect'. Click 'Network' as shown in this pic.
2. Right click on the last entry on the table you see and click 'copy as cURL (bash)'
3. Go to website https://t.co/f8rhwoGLUc and paste on the left box and click 'Run'
4. The output below candles written on right of box is the ohlc, volume and oi data. Copy and paste to excel.