1⃣ Wait, What's Log chart?
Before I define Log chart, let's look at the chart you are using daily - 'The Linear Chart'
- Linear chart is used by default in most platforms. This is probably why you never knew log charts
Wait, don't click on 'log' yet before you understand it...
2⃣ ok, so what does Linear chart mean?
Take a look at the image
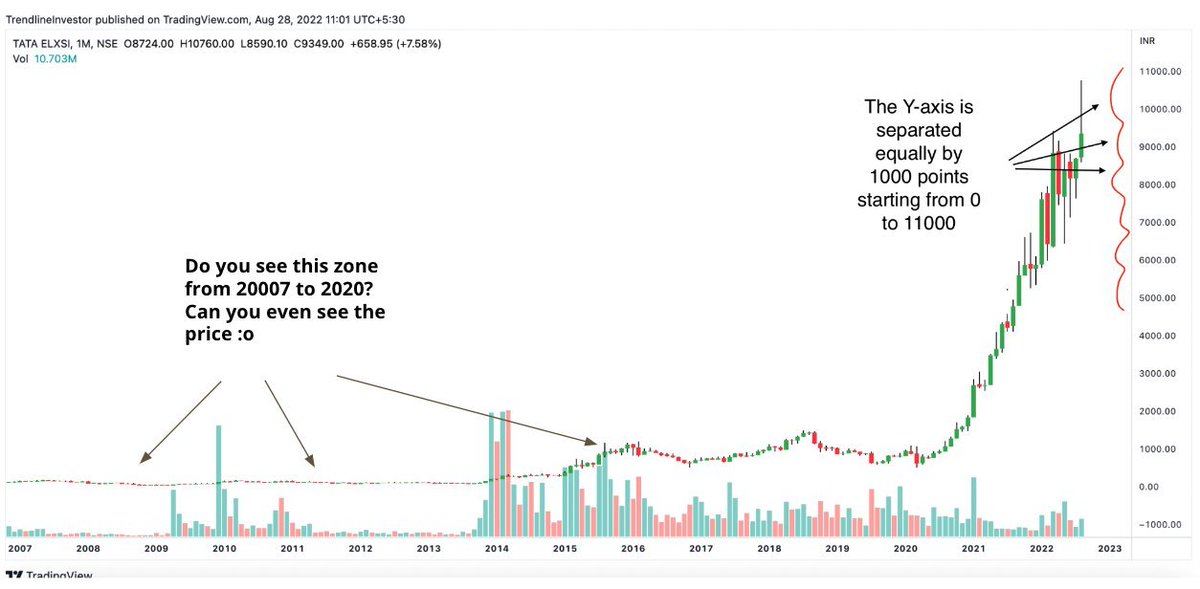
- The y-axis is separated equally by 1000 points starting from 0 to 11000.
- So, any linear chart would have its y-axis equally separated by 'N' points always
And... that's where the problem lies...
3⃣ But, I don't see any problem?🤔
Ok ok.. let me explain...
- Can you look at this #TATAELXSI chart & tell me the price in '99 when it was listed? No!
- Can you draw a proper trendline in this chart? No!
Reason is because of the price congestion between '07 to '20...
4⃣ What else?🧐
- Whenever there is a price change in an instrument & it's drastic it'd be difficult to analyse on a linear chart
- Look at this example of #BTCUSD. What happened in 2021(refer to the red box)? 🤔
All this is because of the equally spaced Y-axis!
hmmm... ok🙄
5⃣ Let's talk about our hero - 'The Log Chart' 🦸♂️
Let's click on log first (refer chart)...
Do you see the change in the same #TATAELXSI chart? 😃(Reason in chart)
Yes, but what do you see?..
There you go!
- Price trend visible clearly
- You can identify trends since listing
6⃣ Here's a side-by-side comparison
- Basically a log scale considers the 'Percentage' price change in the Y-axis which makes a huge difference especially where prices have moved dramatically
- This dramatic price change could have happened in just a month or over many years
7⃣ Ok, so when to use log/linear scale
- See, in the short term charts log/linear scale don't make a difference (Refer chat)
- If you're purely an intraday or a short term trader, then you can continue to use linear charts
But, if price moves drastically(crypto) then use log...
8⃣ But, I am a long term investor + swing/positional trader?
Yes, then you ought to switch to 'Log chart' FOREVER so that...
- You can analyse charts properly
- Draw clean trendlines
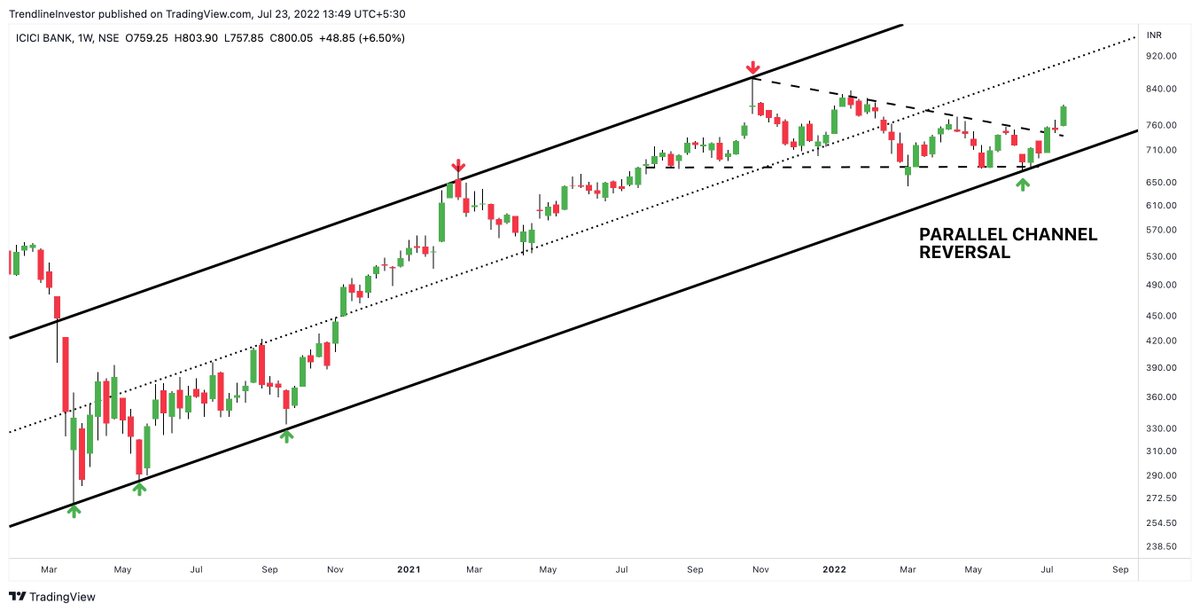
- Identify primary trendline/channel reversals
Short term charts should be just fine with log!
9⃣ So, the next time you see a big handle analysing a long term chart with 'Linear chart' like this on #twitter 🤦♂️share this thread on that tweet and kill it🔪
And, yes switch to 'Log' now...🫡
🔟 If you read till here & ♥️ this thread, then you are definitely going to like my video explanation & also my 'Learn with Trendline Investor' Playlist on Youtube!
Check it out!
https://t.co/Rwu5uiflk9
Learnt something? If yes, please👇
1. Retweet the first tweet
https://t.co/oMTfmo76QP 2. Follow
@dmdsplyinvestor 3. Subscribe to my YouTube channel for more content!
https://t.co/yNCTzHWpi6