5 Ways Weekly Charts can help your Trading & Investing
📈📉 (Thread)
This will lead to better decision making.
For traders they are the "prevailing wind" and trading with this weekly trend will increase probabilities and help you remember to focus on larger patterns
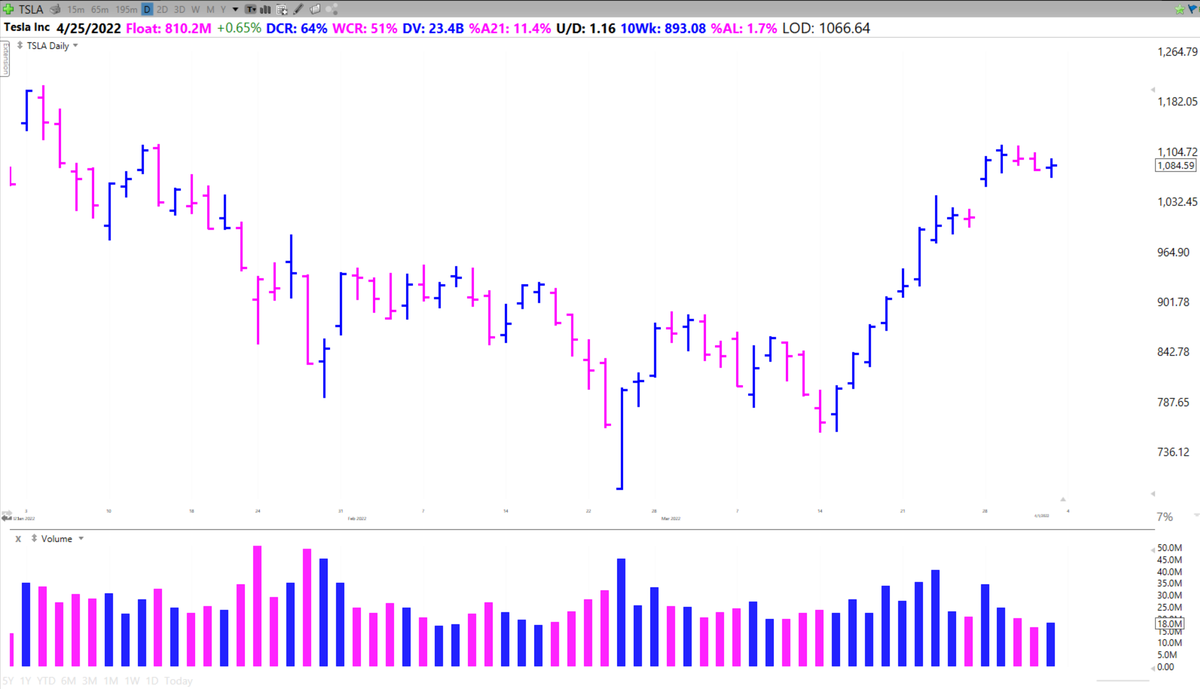
Weekly charts eliminate a lot of the back and forth that occurs intraday and on daily charts. What is left is often a clear picture of the trend of a stock.
⬆️ Trending Up
↔️ Basing
⬇️ Trending Down
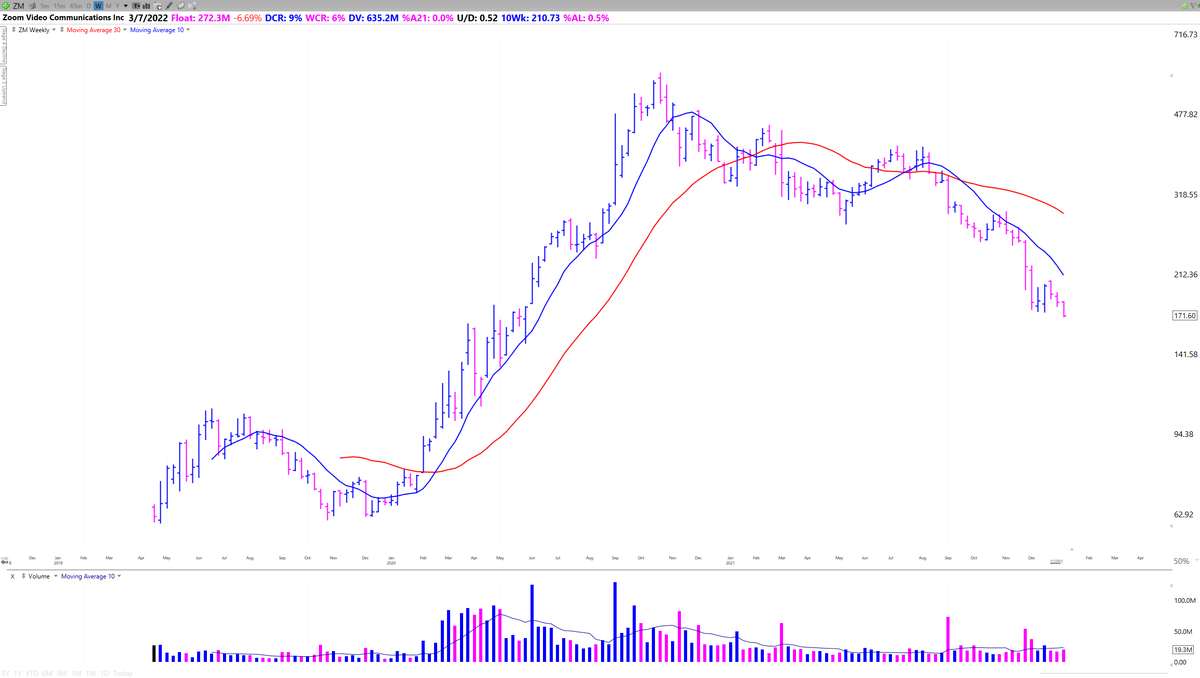
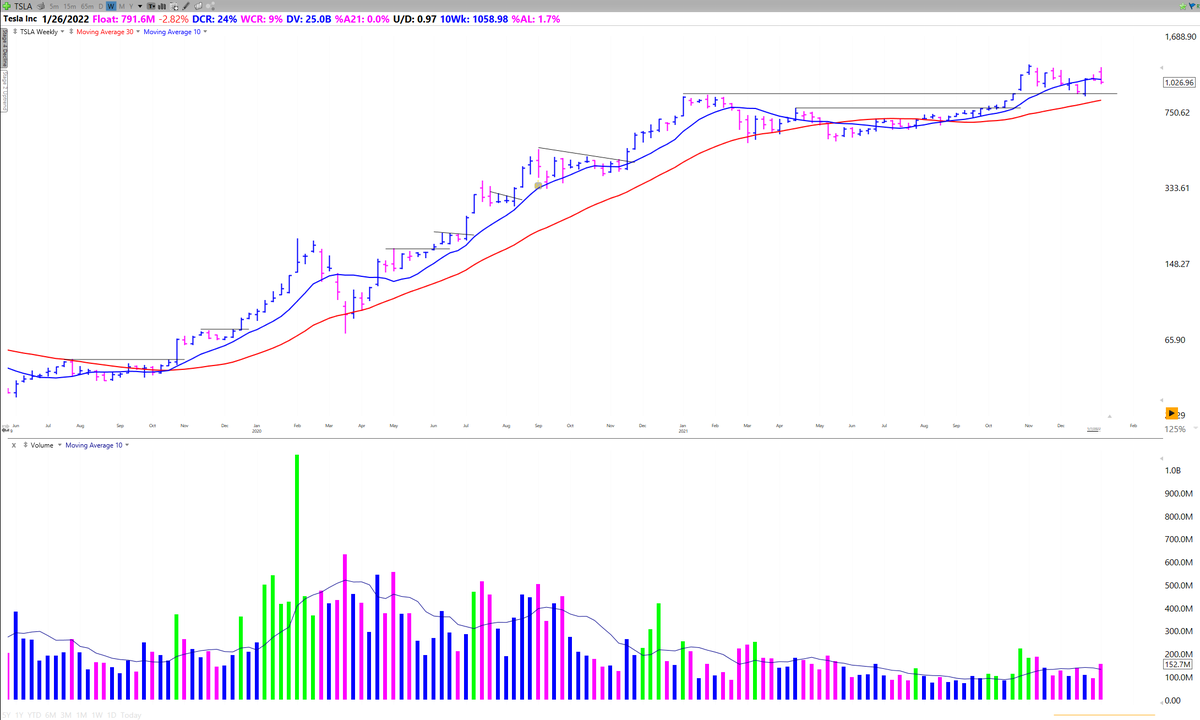
During a strong uptrend you will be amazed at how well the 10 week line acts as a guardrail for a stock's move
$ZM increased 450% in 10 months, undercutting the 10 week only once

This is because it is often a spot where institutions build/add to positions on pullbacks.
$DOCN advanced 150% in 6 months holding the 10 week sma

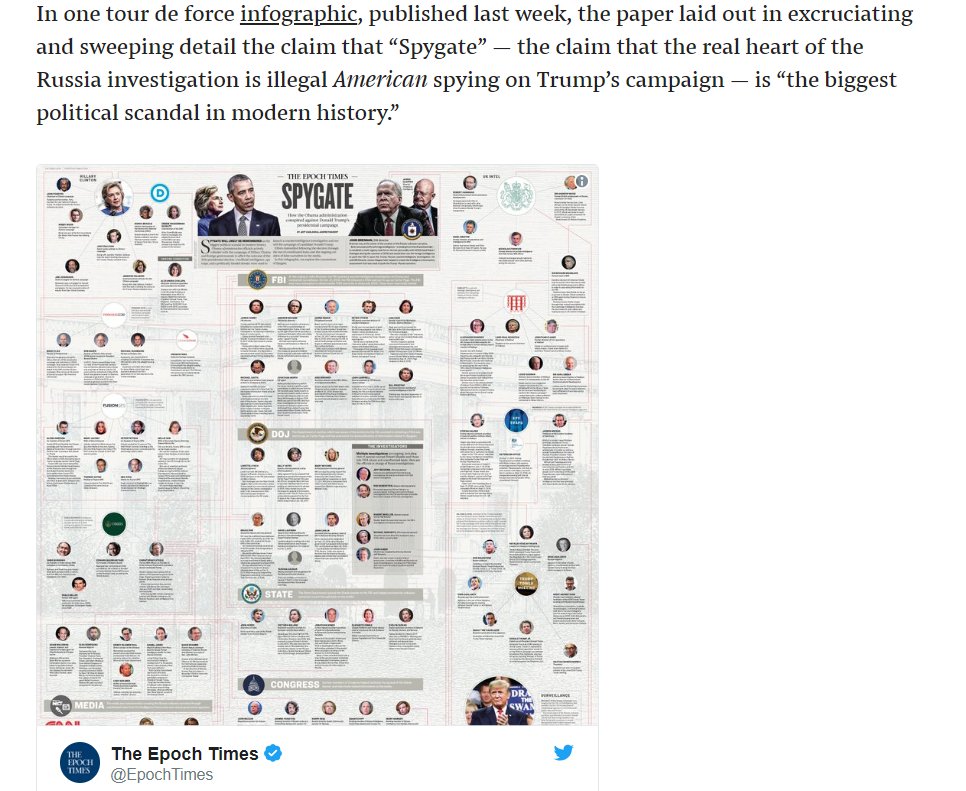
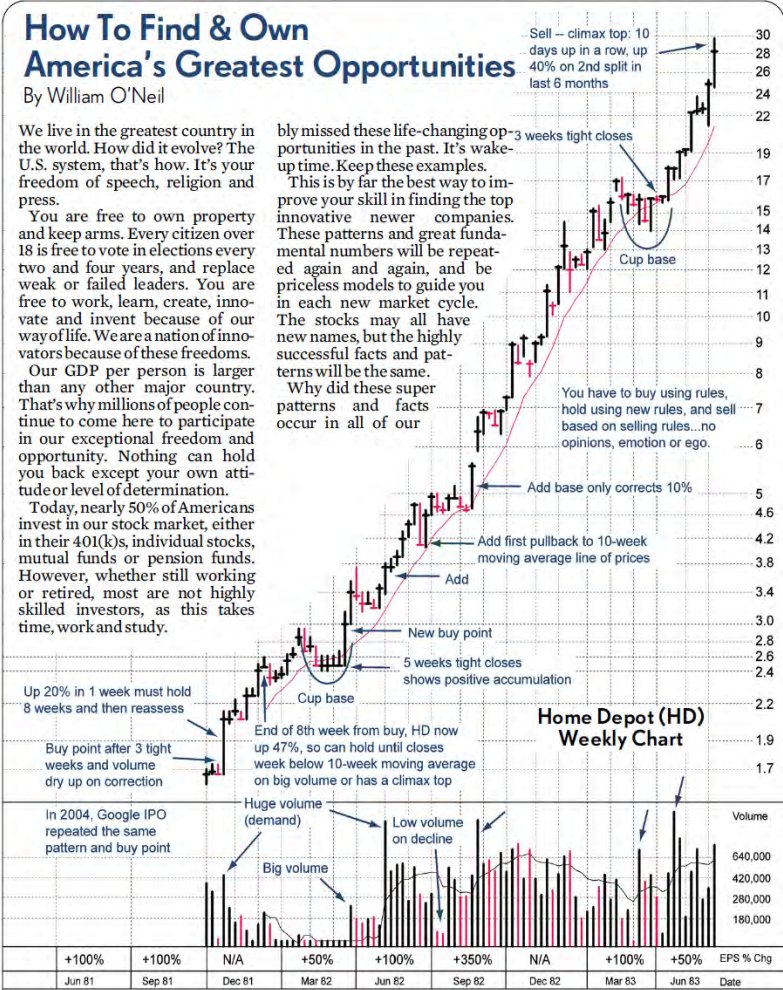
Here's is $HD's powerful move in 1981
The red line is the 10 week SMA.
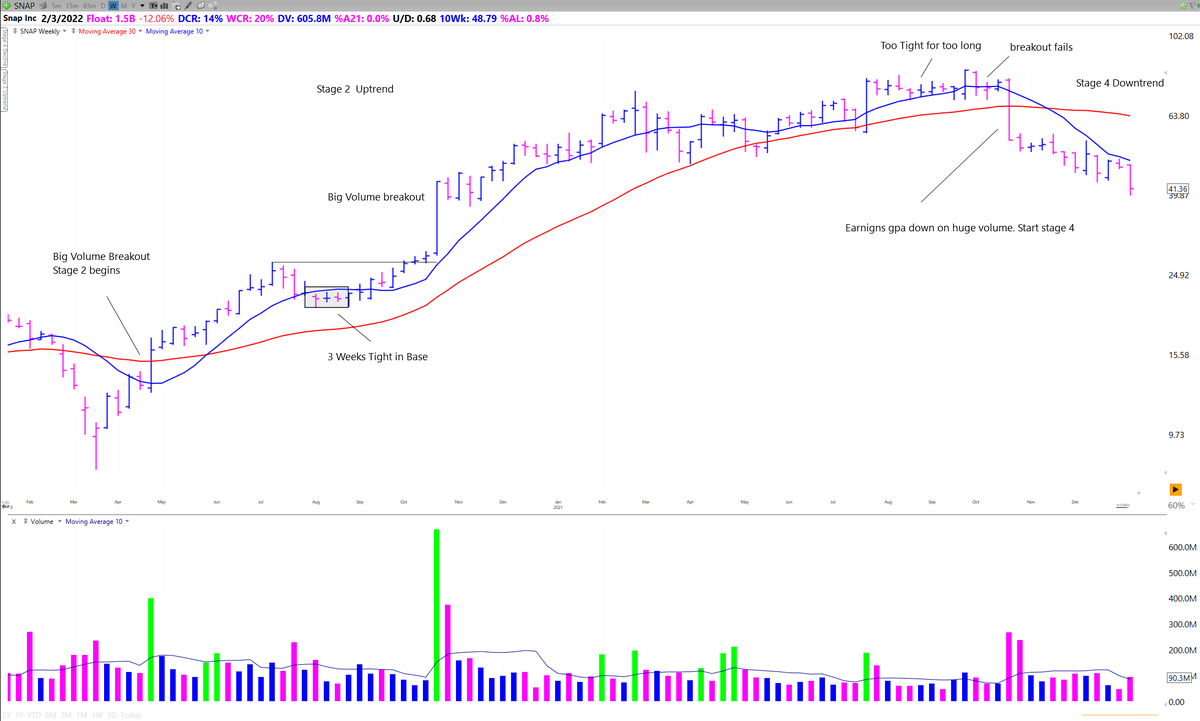
Stage 1 - Basing
Stage 2 - Advance
Stage 3 - Consolidation
Stage 4 - Distribution
The big money in made during S2 Uptrends and the big money is lost in S4 Declines

S2 - Starts with a big volume breakout from a base, Price starts trending above a rising 30 week MA
S3 - Price chops around a flattening 30 week ma
S4 - Price starts trending below a declining 30 week MA
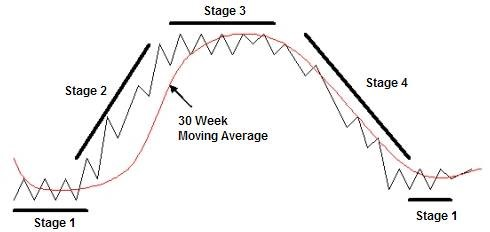
Both investors and traders should focus on stocks beginning or in Stage 2 Uptrends.
My Interview with Stan:
🔗https://t.co/G5jsyL5BMo
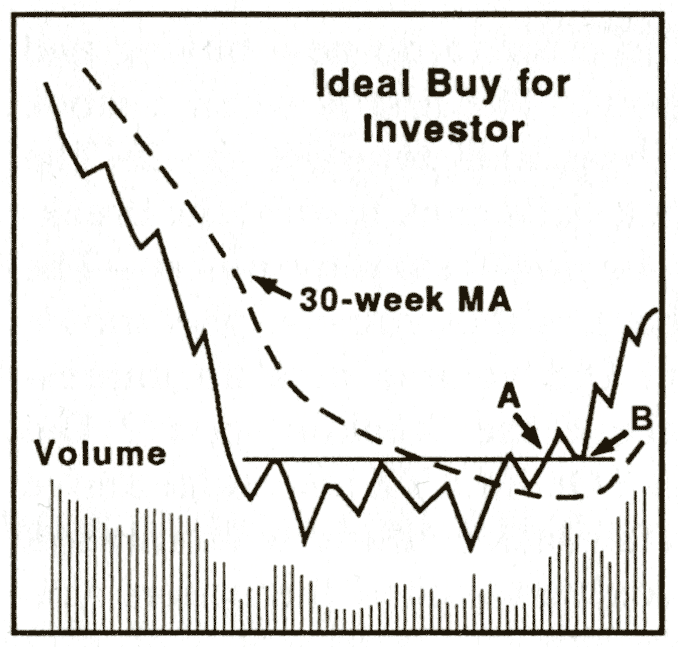
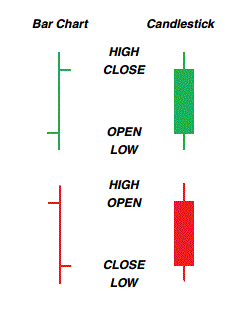
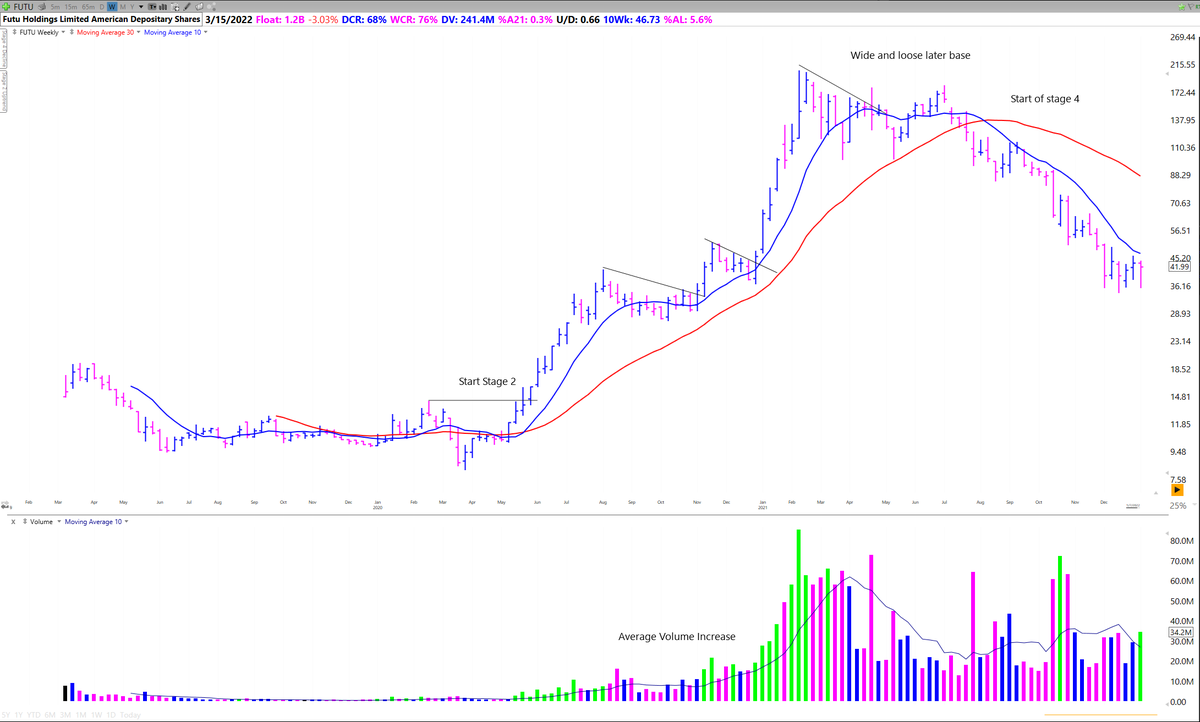
Institutions can't hide when they begin and continue accumulating positions.
Look for.
✅ Huge Volume Spikes
✅ Tight Weekly Closes
✅ Increasing average weekly volume
Look at significant volume weeks and determine based on context and CR if a stock is being accumulated or distributed
Also look for this after a breakout to see if institutions are still building positions
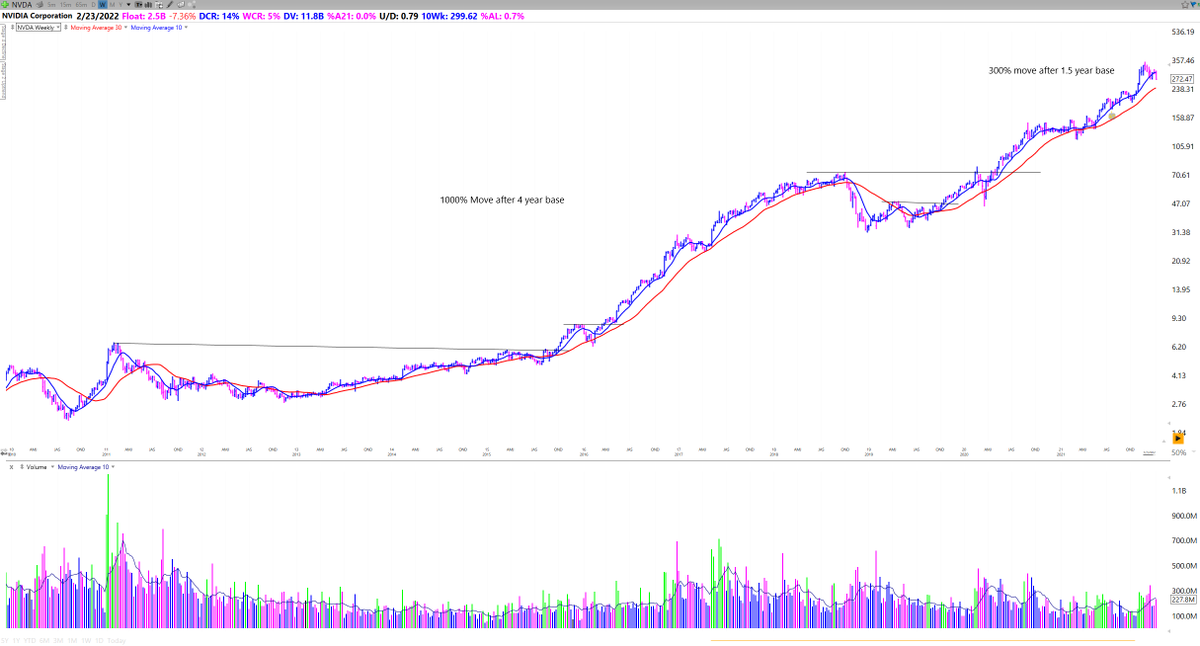
100% + moves begin with a long basing period and a strong breakout.
Focus on 👇
✅ Recent IPOs after their first big base
✅ Mature names after they have consolidated
Read "The Lifecycle Trade" for more info
📘https://t.co/PuofeP4Mkc
@EBoboch
@KGD_Investor
@EricKrull1
@Top_Dog_102

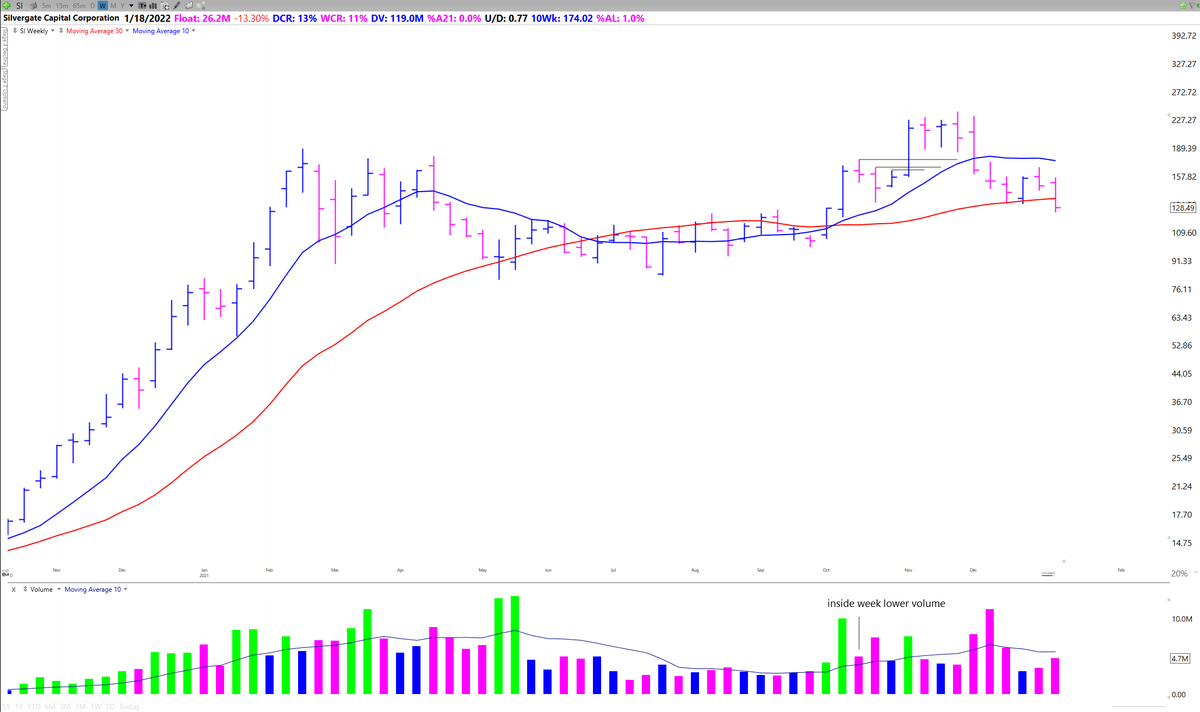
As mentioned previously, weekly charts remove intraday and daily chop. The stock can move a lot throughout the week but it is the institutions who control where it closes.
Always make sure you are stacking probabilities and trading with the weekly trend.
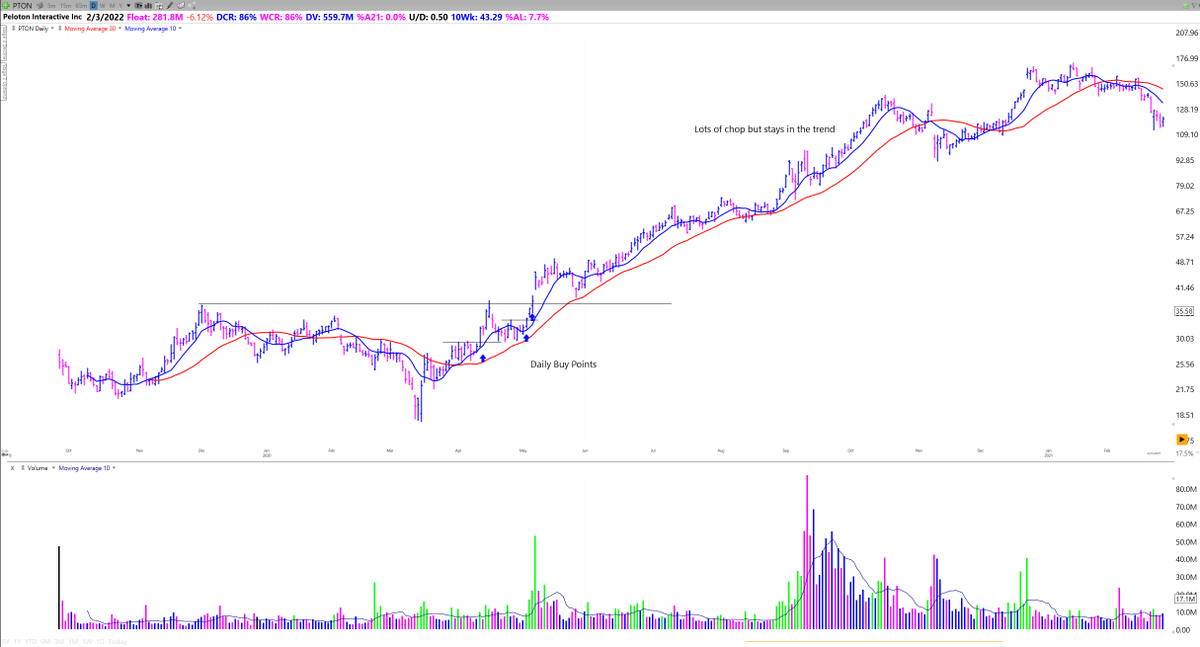
Position and even swing traders should also consider buying on a daily chart but then switching over to a weekly once the trend is established
Here's an example with $PTON buying on the daily and then managing the position on a weekly.
When the weekly trend changes PAY ATTENTION.
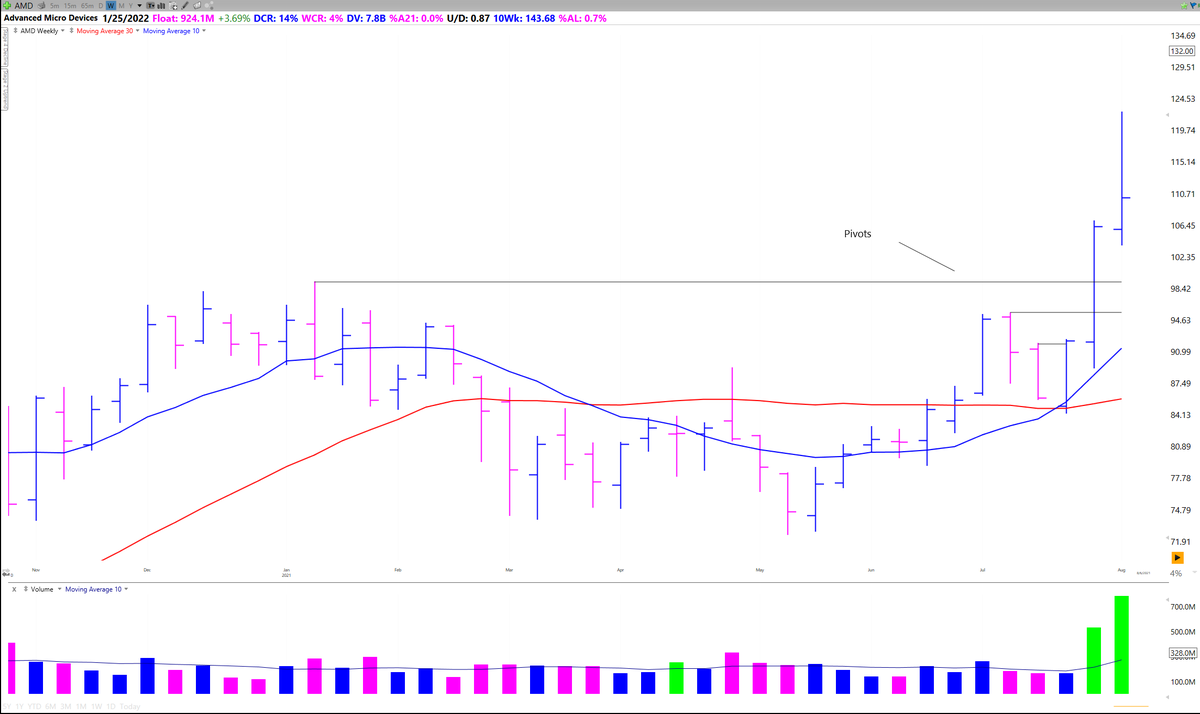
Weekly chart highs and closes are excellent pivots to use on a daily chart for shorter term traders.
If you did please like and retweet the first tweet (linked below) 👇🔁
Also tag anyone else who you think would find it interesting. Take care!
https://t.co/6G431IkBDQ
5 Ways Weekly Charts can help your Trading & Investing
— Richard Moglen \U0001f4fd\ufe0f\U0001f981\U0001f6a2 (@RichardMoglen) January 9, 2022
\U0001f4c8\U0001f4c9 (Thread)
https://t.co/TvGS94qkPP
More from Richard Moglen 📽️🦁🚢


How to time the market (thread)
There is the old saying that “Time in the market beats timing the market” The chart below from Dr. Wish’s @WishingWealth presentation at the @TraderLion_ conference shows that to be false.
Full presentation: https://t.co/o2f21GBXci
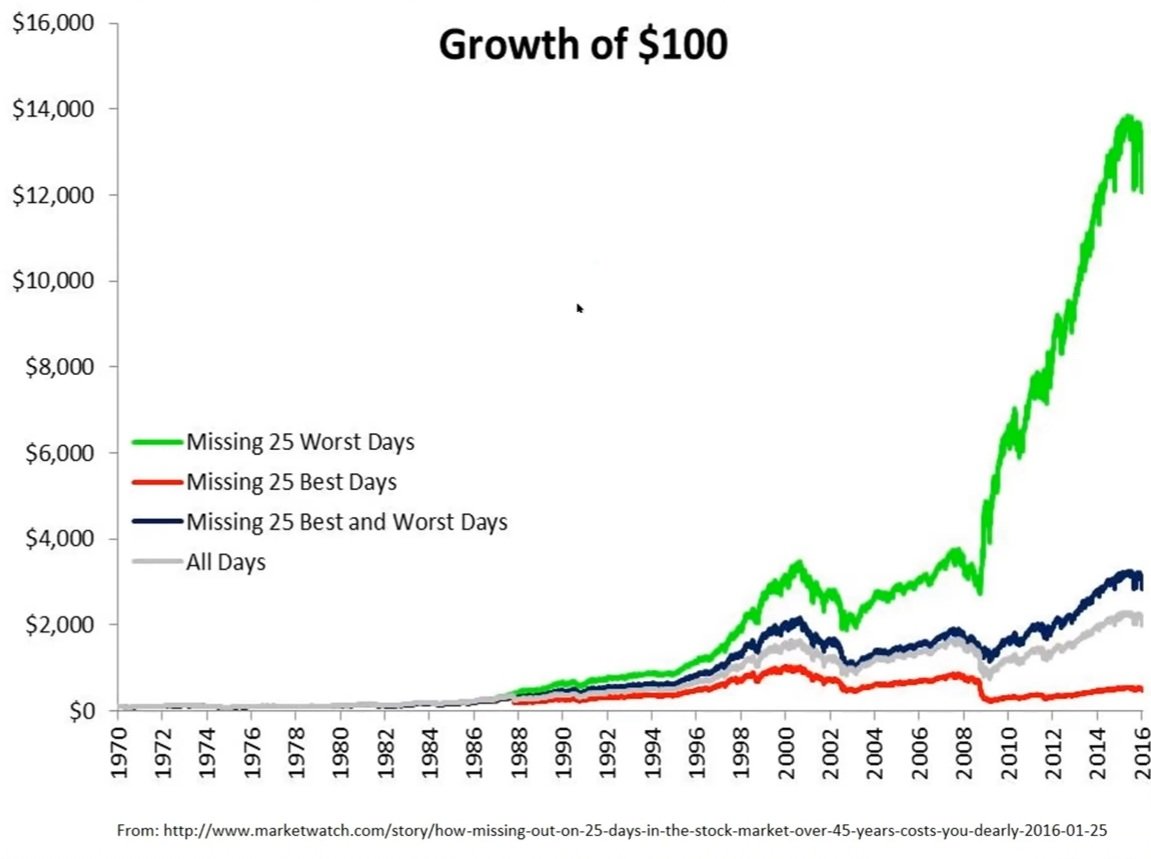
The green line is unattainable realistically, however, missing volatile times during corrections yields better performance than buy and hold and we can aim for the green line.
Investors usually only show the gray and red results.
More
There are many strategies for investing/trading in the stock market operating within different timeframes and with different objectives.
That is of course what creates a market and opportunity. Timing the market may not be what works for you or what fits your goals/lifestyle.
However, everyone involved in the market is here to make money over time and corrections can cause huge drawdowns in the high alpha names negating incredible performance during strong market uptrends.
There is the old saying that “Time in the market beats timing the market” The chart below from Dr. Wish’s @WishingWealth presentation at the @TraderLion_ conference shows that to be false.
Full presentation: https://t.co/o2f21GBXci
The green line is unattainable realistically, however, missing volatile times during corrections yields better performance than buy and hold and we can aim for the green line.
Investors usually only show the gray and red results.
More
There are many strategies for investing/trading in the stock market operating within different timeframes and with different objectives.
That is of course what creates a market and opportunity. Timing the market may not be what works for you or what fits your goals/lifestyle.
However, everyone involved in the market is here to make money over time and corrections can cause huge drawdowns in the high alpha names negating incredible performance during strong market uptrends.