Stan Weinstein's Stage Analysis offers traders a powerful methodology to identify trends in the markets while following strict risk management principles.
1/
First, let's review who Stan Weinstein is and his contributions to the market.
Weinstein is a veteran technical trader who has over 50 years of experience and now works as an advisor for institutional investors.
2/
Stan is well known for authoring "Secrets for Profiting in Bull & Bear Markets" which you can find at the link below.
This book is incredibly well written and gets into the nitty-gritty of his processes in the markets.
https://t.co/VQB2EbDUOU 3/
So, what is Stage Analysis?
Stage Analysis is used to identify the longer-term trend of a stock or index. There are 4 different stages 👇
The Basing Area, Advancing Phase, The Top Area, and Declining Phase.
4/
Stage 1: The Basing Area
This stage occurs at the bottom of a longer term base or during the first primary base a stock forms after it’s IPO.
During this stage the stock is oscillating under a declining 30 week moving average.
5/
🔑 Traits in Stage 1 👇
✅ Buyers and sellers start to balance each other out
✅ There is a volume dry up, signaling major selling has subsided
✅ Volume will start to increase towards the end of the period without significant price concession
6/
Below is an example of $TSLA going from Stage 1 to Stage 2. Note how price was unable to break above the declining 30 week MA, and then did so in a big way on volume. Price would then progress into a sustained Stage 2: Advancing Phase.
7/
Stage 2: Advancing Phase
This is the stage where we should be looking to take long positions in a stock or index. Buyers are now in control and the balance of power is now in line with demand.
8a/
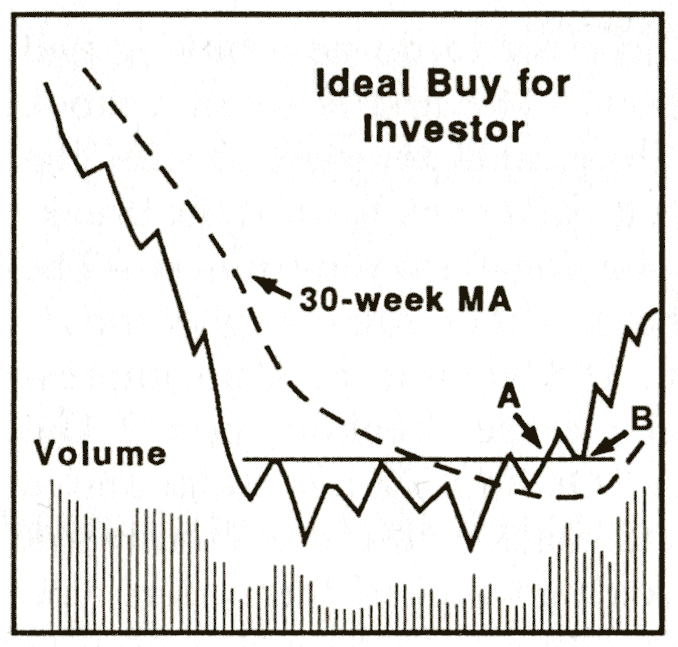
Stage 2: The Ideal Buy Point for Investors
Investors should watch for the first breakout on volume just as the stock begins a new Stage 2 uptrend.
Investors can buy the breakout or the retest of the pivot point.
8b/
Stage 2: The Ideal Buy Point for Traders
Traders should look for bases within an existing Stage 2 uptrend and focus on breakouts on volume.
Intermediate term traders can also use investor buy points.
8c/
🔑 Traits in Stage 2 👇
✅ Breakout above the resistance zone & 30 week MA on big volume
✅ Post initial breakout, there is usually a retest of the breakout point
✅ 30 week MA starts turning up shortly after the breakout
9/
Here is an example of $PTON below 👇
Note how $PTON exhibited all of the key traits we are looking for to start a Stage 2: Advancing Phase.
10/
Here is another example of Stage 2 using $NVDA.
Note how massive volume came into the stock and solidified itself above the 30 week moving average, followed by a retest of the 30 week moving average and subsequent move higher.
11/
While we want to be focused on stocks moving into Srage 2 uptrends, we want to make sure we are still managing risk along the way. This means we have to ensure we are buying right. and using stop losses.
12/
Stage 3: The Top Area
This stage occurs during longer-term bases in a stock’s lifecycle after a Stage 2 Uptrend. The stock is oscillating up and down around the 30-week moving average, showing there is no clear uptrend but also no clear downtrend.
13/
🔑 Traits in Stage 3 👇
✅ 30 week MA starts flattening out w/ price chopping above & below this line
✅ Balance has returned between buyers & sellers, leading to sideways action
✅ News/earnings are exciting, but we have to wait for a trend
14/
$AMZN is a good example of a chart that had a clear Stage 2 Advance, followed by a Stage 3: The Top Area.
Clearly, buyers were met with equal force from sellers and price oscillated above and below the 30 week moving average.
15/
It is important to understand that not all stocks that go into a Stage 3 rollover and go into a Stage 4: Declining phase.
It is very normal to see many Stage 2's and Stage 3's in a row in a winning stock.
$SHOP is a great example of this ⬇️
16/
Stage 4: The Declining Phase
This stage occurs when sellers take control and outlast the buyers. Price will begin to trend below a declining 30 week moving average.
The big money is lost going/staying long in a Stage 4 decline.
17/
🔑 Traits in Stage 4 👇
✅ Price breaks below the bottom of the support zone
✅ Don't need overwhelming volume to the downside to enter a Stage 4
✅ No matter how the fundamentals appear, the price trend is all that matters
18/
Here is an example of $SPX from 2008.
19/
Here is another example of $CSCO making a Stage 4 decline as well.
20/
Major 🔑
The active trader/investor must take note of the slope of the 30 week moving average. Every time the 30 week moving average flattens itself out, the stock is set to make a trend decision.
Be ready to act if it enters either a Stage 2 or Stage 4.
21/
The trend of the weekly chart and the Stage a stock is in reveal the net accumulation/distribution by institutions. This price trend is looking at the future expectations of earnings and regardless of the current fundamentals must be respected.
22/
For more information on Stage Analysis learn from our interview with Stan himself!
👇
https://t.co/9BvJpXJ52m
Also be sure to check out our video featuring
@richardmoglen covered the concept and going through examples.
👇
https://t.co/itFdReYCRE
@RichardMoglen If you enjoyed this thread make sure to retweet and check out our FREE weekly newsletter.
⬇️⬇️⬇️
https://t.co/Q9MjxVAAgL