
Well, we’re between coup attempts and attempts to throw out a seditionist president, so I’m going to take the opportunity to describe this research that was recently accepted in @SERestoration for the grassland ecology SF.
New #RestorationEcology article! https://t.co/lEKdclptYc
— SERestoration (@SERestoration) December 23, 2020
"This study provides a path toward a new level of ease and precision in monitoring community dynamics of restored grasslands." \U0001f33f pic.twitter.com/kM7L9y2jrR


Parrot provided this drone to us via a climate change grant (thanks, Parrot!).
Here is how takeoffs are supposed to go, btw.








— Ryan C Blackburn (@Blackburn_RC) January 8, 2021
More from Tech

Recently, the @CNIL issued a decision regarding the GDPR compliance of an unknown French adtech company named "Vectaury". It may seem like small fry, but the decision has potential wide-ranging impacts for Google, the IAB framework, and today's adtech. It's thread time! 👇
It's all in French, but if you're up for it you can read:
• Their blog post (lacks the most interesting details): https://t.co/PHkDcOT1hy
• Their high-level legal decision: https://t.co/hwpiEvjodt
• The full notification: https://t.co/QQB7rfynha
I've read it so you needn't!
Vectaury was collecting geolocation data in order to create profiles (eg. people who often go to this or that type of shop) so as to power ad targeting. They operate through embedded SDKs and ad bidding, making them invisible to users.
The @CNIL notes that profiling based off of geolocation presents particular risks since it reveals people's movements and habits. As risky, the processing requires consent — this will be the heart of their assessment.
Interesting point: they justify the decision in part because of how many people COULD be targeted in this way (rather than how many have — though they note that too). Because it's on a phone, and many have phones, it is considered large-scale processing no matter what.
It's all in French, but if you're up for it you can read:
• Their blog post (lacks the most interesting details): https://t.co/PHkDcOT1hy
• Their high-level legal decision: https://t.co/hwpiEvjodt
• The full notification: https://t.co/QQB7rfynha
I've read it so you needn't!
Vectaury was collecting geolocation data in order to create profiles (eg. people who often go to this or that type of shop) so as to power ad targeting. They operate through embedded SDKs and ad bidding, making them invisible to users.
The @CNIL notes that profiling based off of geolocation presents particular risks since it reveals people's movements and habits. As risky, the processing requires consent — this will be the heart of their assessment.
Interesting point: they justify the decision in part because of how many people COULD be targeted in this way (rather than how many have — though they note that too). Because it's on a phone, and many have phones, it is considered large-scale processing no matter what.


The 12 most important pieces of information and concepts I wish I knew about equity, as a software engineer.
A thread.
1. Equity is something Big Tech and high-growth companies award to software engineers at all levels. The more senior you are, the bigger the ratio can be:

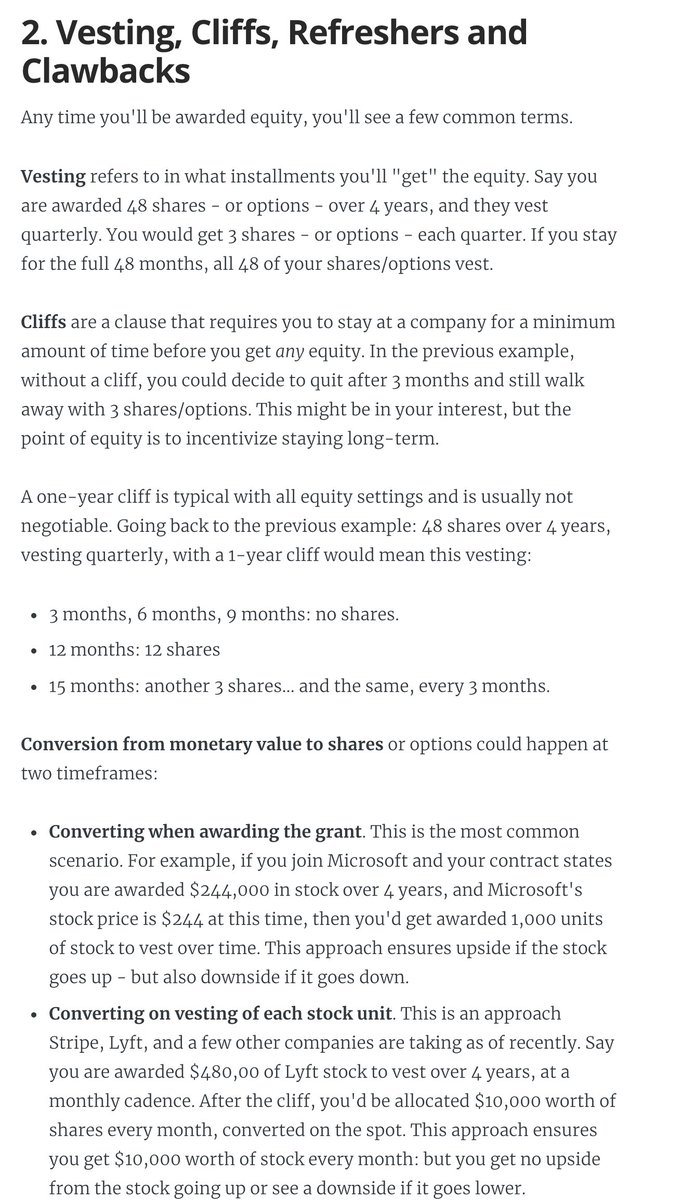
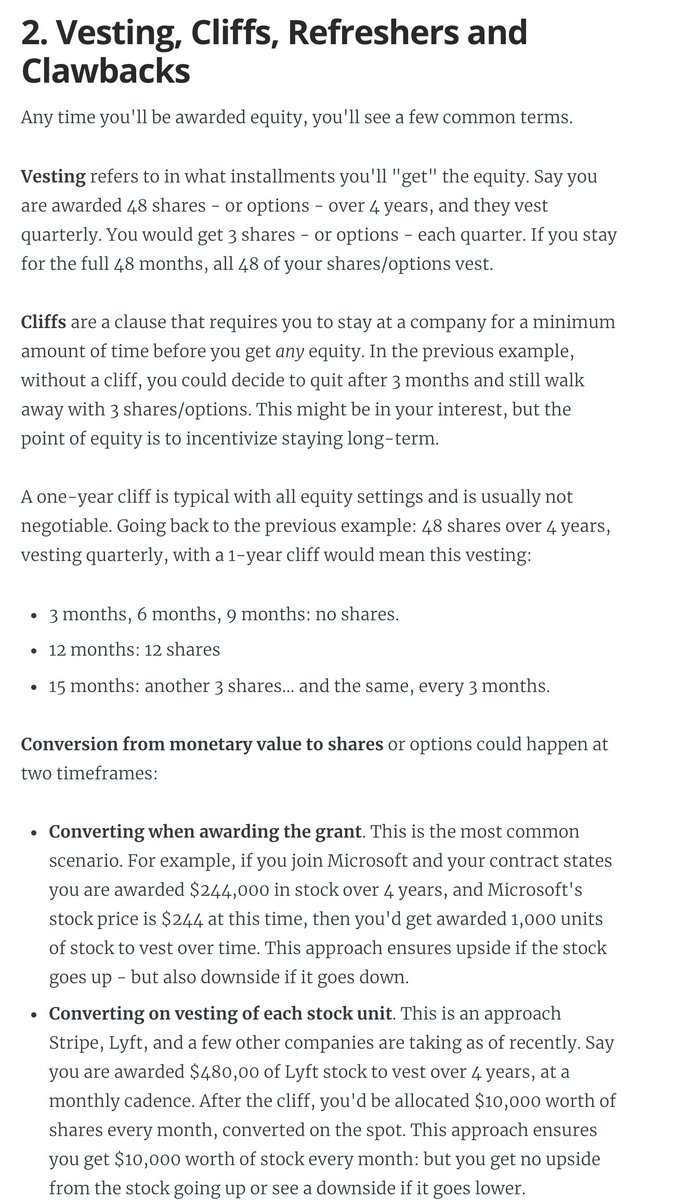
2. Vesting, cliffs, refreshers, and sign-on clawbacks.
If you get awarded equity, you'll want to understand vesting and cliffs. A 1-year cliff is pretty common in most places that award equity.
Read more in this blog post I wrote: https://t.co/WxQ9pQh2mY
3. Stock options / ESOPs.
The most common form of equity compensation at early-stage startups that are high-growth.
And there are *so* many pitfalls you'll want to be aware of. You need to do your research on this: I can't do justice in a tweet.
https://t.co/cudLn3ngqi
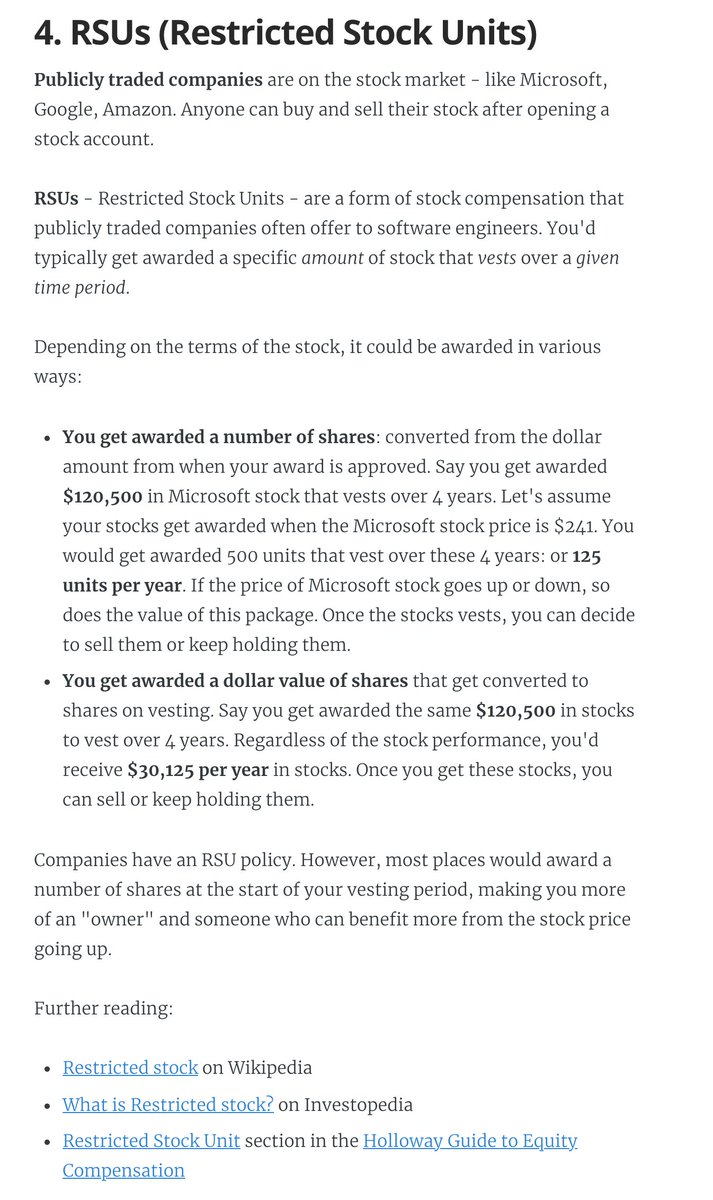
4. RSUs (Restricted Stock Units)
A common form of equity compensation for publicly traded companies and Big Tech. One of the easier types of equity to understand: https://t.co/a5xU1H9IHP
5. Double-trigger RSUs. Typically RSUs for pre-IPO companies. I got these at Uber.
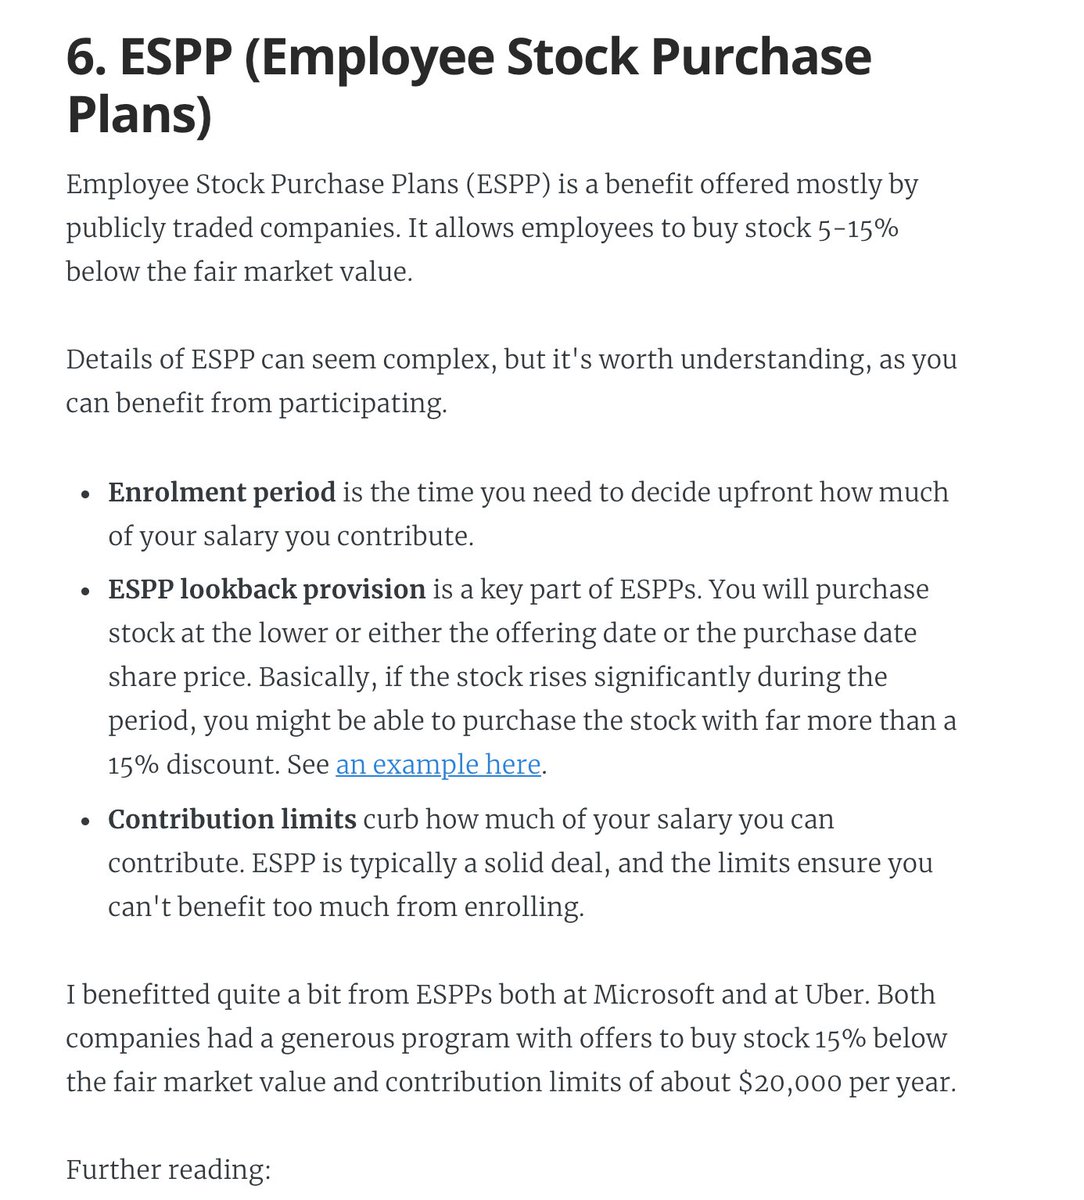
6. ESPP: a (typically) amazing employee perk at publicly traded companies. There's always risk, but this plan can typically offer good upsides.
7. Phantom shares. An interesting setup similar to RSUs... but you don't own stocks. Not frequent, but e.g. Adyen goes with this plan.
A thread.
1. Equity is something Big Tech and high-growth companies award to software engineers at all levels. The more senior you are, the bigger the ratio can be:
2. Vesting, cliffs, refreshers, and sign-on clawbacks.
If you get awarded equity, you'll want to understand vesting and cliffs. A 1-year cliff is pretty common in most places that award equity.
Read more in this blog post I wrote: https://t.co/WxQ9pQh2mY
3. Stock options / ESOPs.
The most common form of equity compensation at early-stage startups that are high-growth.
And there are *so* many pitfalls you'll want to be aware of. You need to do your research on this: I can't do justice in a tweet.
https://t.co/cudLn3ngqi
4. RSUs (Restricted Stock Units)
A common form of equity compensation for publicly traded companies and Big Tech. One of the easier types of equity to understand: https://t.co/a5xU1H9IHP
5. Double-trigger RSUs. Typically RSUs for pre-IPO companies. I got these at Uber.
6. ESPP: a (typically) amazing employee perk at publicly traded companies. There's always risk, but this plan can typically offer good upsides.
7. Phantom shares. An interesting setup similar to RSUs... but you don't own stocks. Not frequent, but e.g. Adyen goes with this plan.


