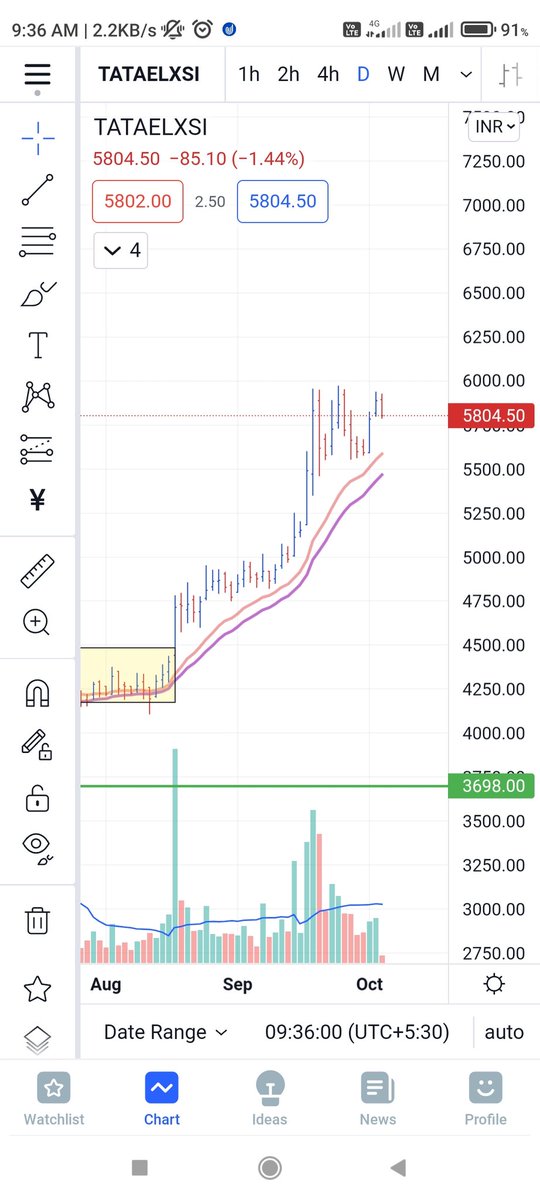
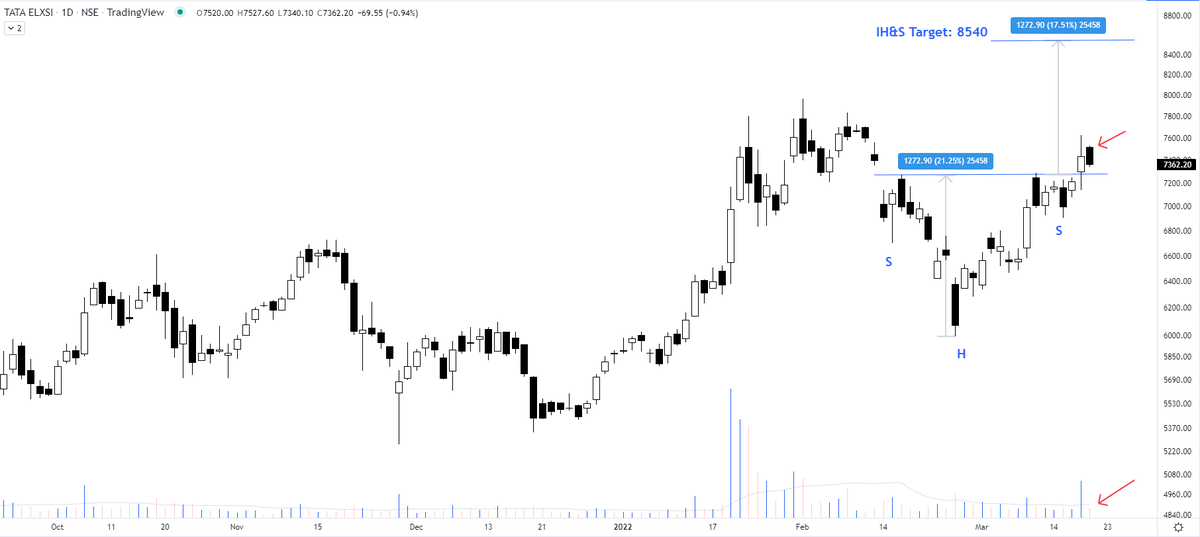
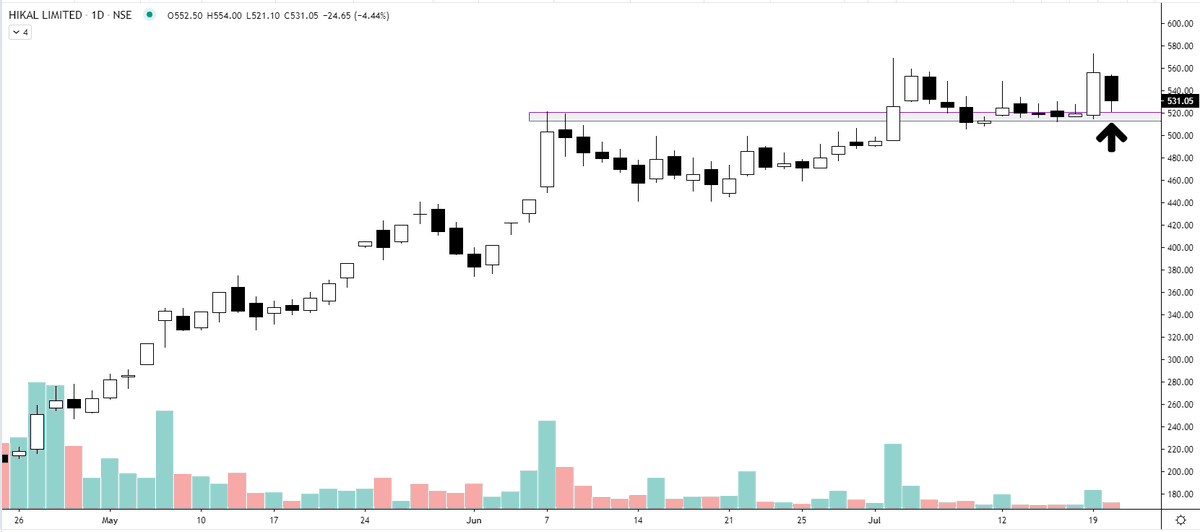
these low-volume pullbacks after the breakout are a common occurrence. However, what is more, important is the stock's reaction after a pullback. It must bounce back within a few sessions strongly to scale up the size.
Tata Elxsi https://t.co/HGCzOz1ALI
Correction \U0001f447
— The_Chartist \U0001f4c8 (@charts_zone) March 20, 2022
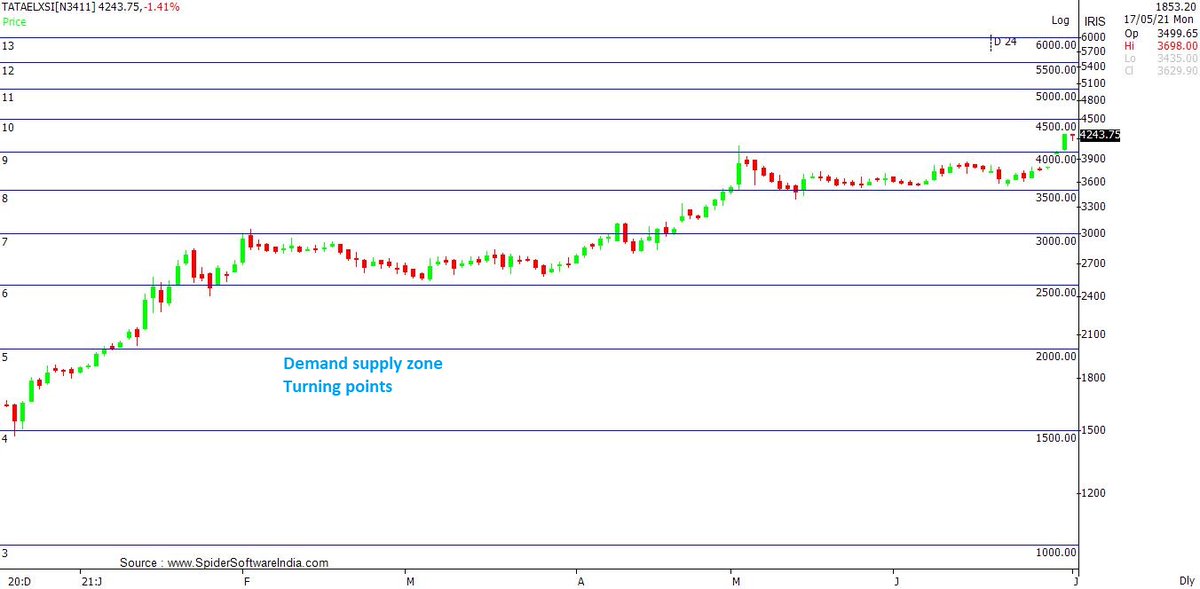
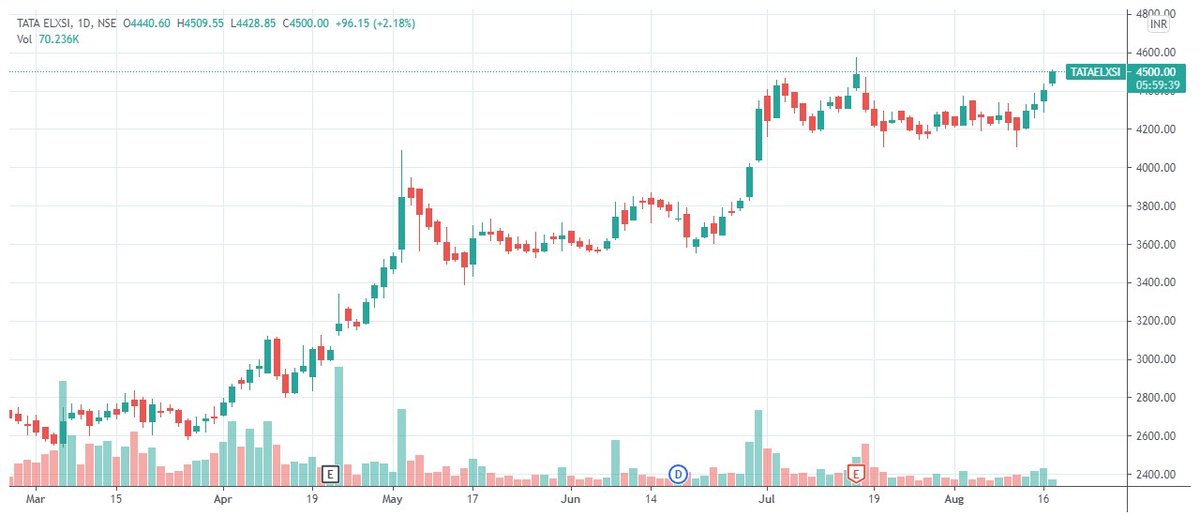
During upward breakouts, I have to consider price targets and not %age targets. Therefore the target comes out to be 8540 and not 8900 as mentioned before.
The chart stands updated.
Tata Elxsi https://t.co/sdP9X1s9qs pic.twitter.com/Gmhn3OYiNA
More from The_Chartist 📈

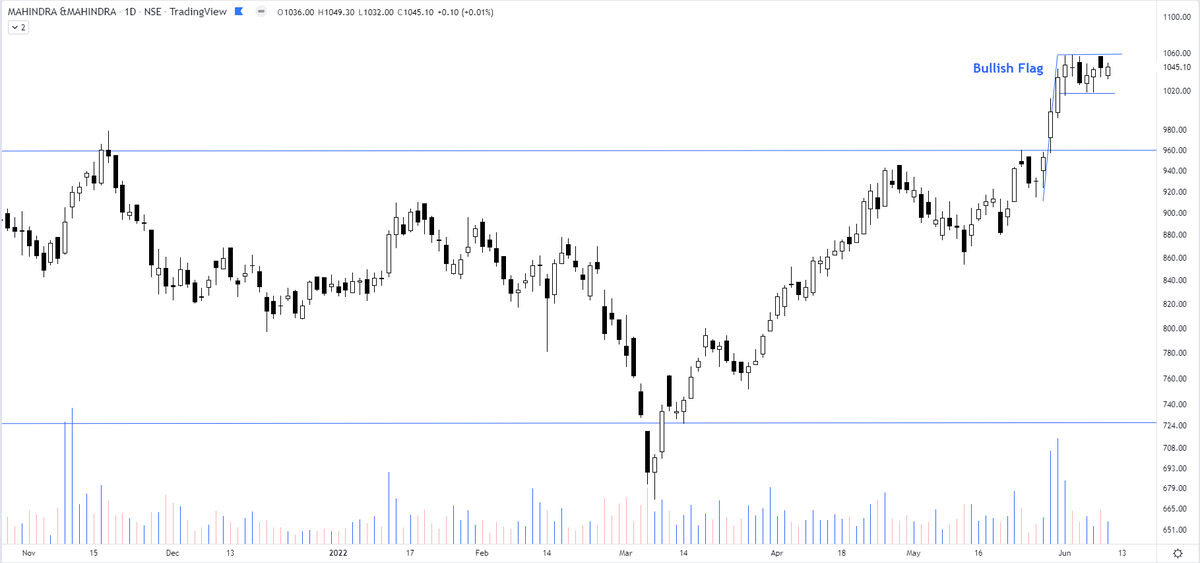
Mahindra & Mahindra - updated chart
A bullish flag pattern right after the breakout. Although the broader rectangle target of 1190 is way more than this bullish flag target https://t.co/wdAzb7SS7L
A bullish flag pattern right after the breakout. Although the broader rectangle target of 1190 is way more than this bullish flag target https://t.co/wdAzb7SS7L
Interesting chart of Mahindra & Mahindra consolidating in a rectangle pattern & the price not falling back to the lower support. pic.twitter.com/GJ7rCfkB9f
— The_Chartist \U0001f4c8 (@charts_zone) May 26, 2022