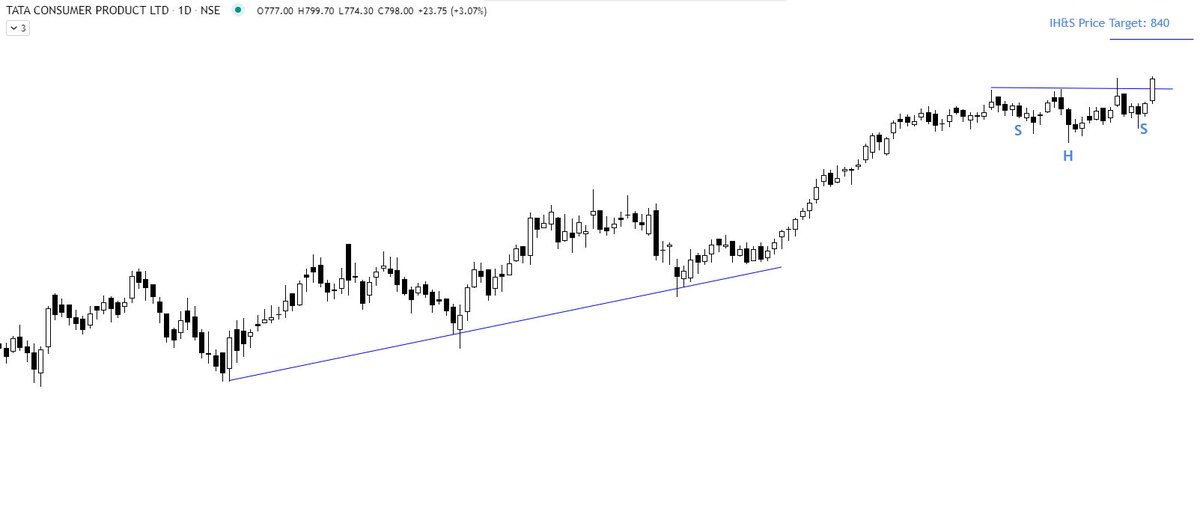
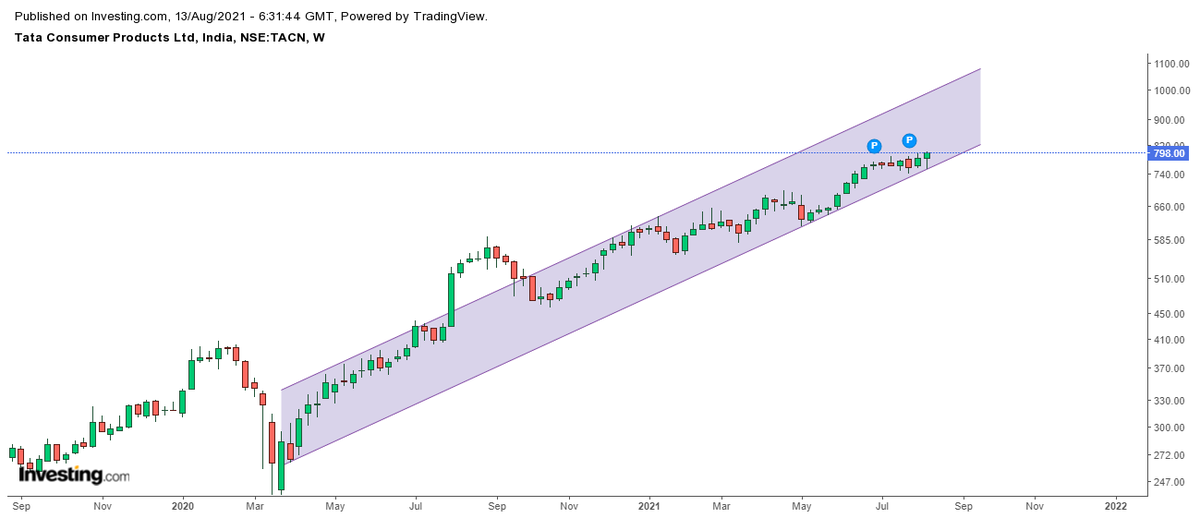
Tata Consumer - - -
Even self-proclaimed TA fail at accepting the fact that IH&S acts as a good continuation pattern. This happens when you are not ready to go beyond what you already know
Edwards & Magee discussed IH&S continuation at legth in their book
More from Steve Nison
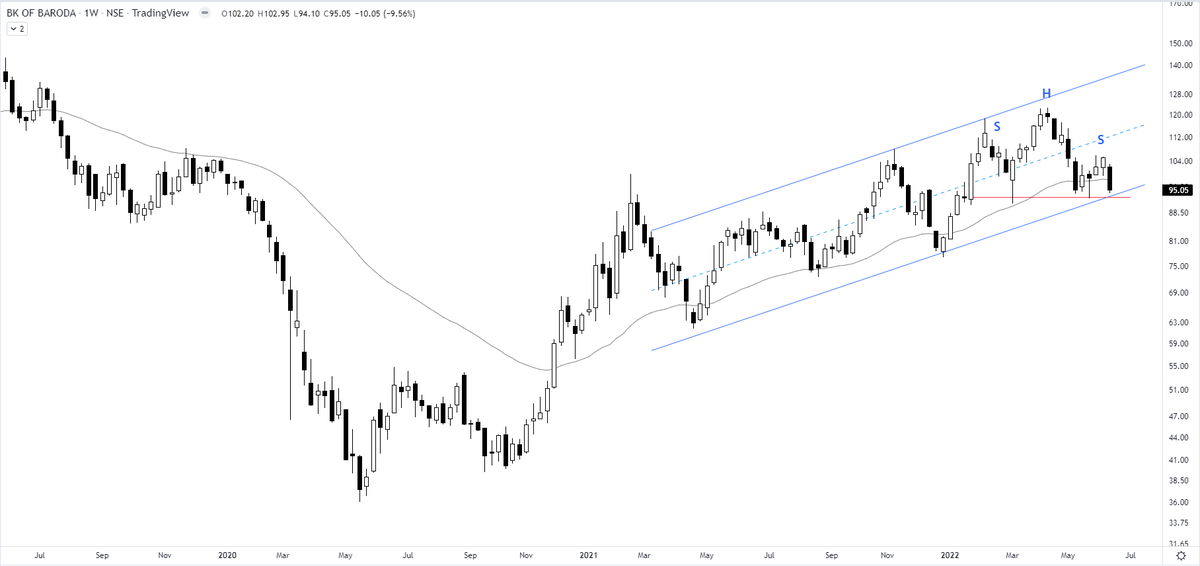
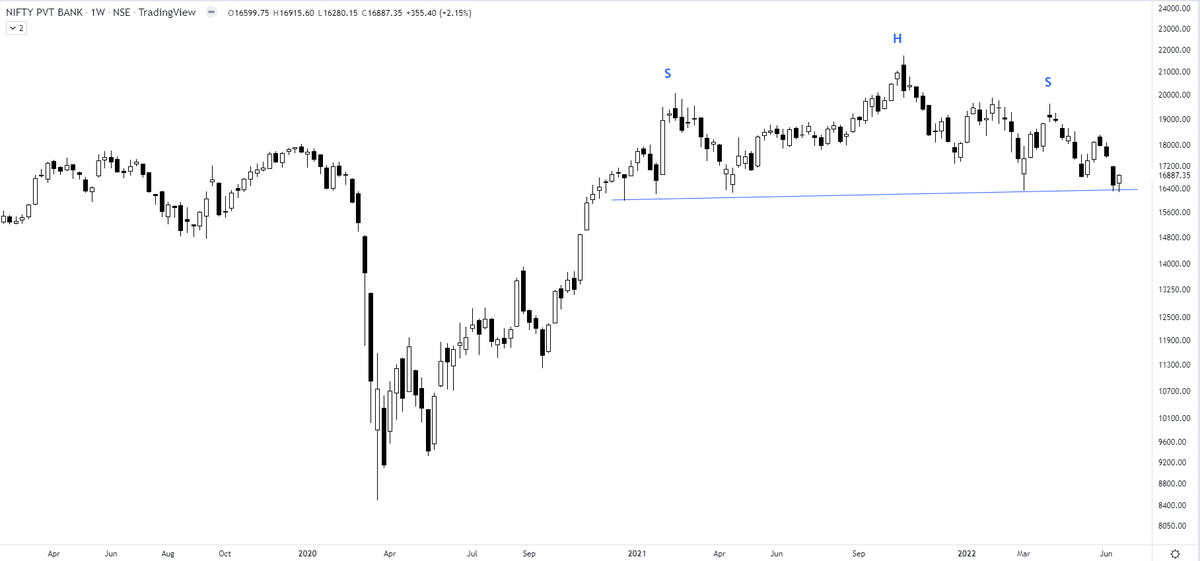
We still haven't got any signal of negation in the private banks' index & if the bearish H&S top has to be negated, the index has to move past 19950. Till then, it will be considered a minor pullback
Nifty Private Bank https://t.co/BwG1DKhhLc
Nifty Private Bank https://t.co/BwG1DKhhLc
I am watching a big bearish H&S top building up in Nifty Private Bank Index. Any breakdown will result in increased volatility in respective charts. For traders - definitely not a spot to be in. The index has to move beyond 19900 to negate the pattern. pic.twitter.com/IGFeyNrtQV
— The_Chartist \U0001f4c8 (@charts_zone) June 19, 2022
More from Tataconsumer


You May Also Like


Nano Course On Python For Trading
==========================
Module 1
Python makes it very easy to analyze and visualize time series data when you’re a beginner. It's easier when you don't have to install python on your PC (that's why it's a nano course, you'll learn python...
... on the go). You will not be required to install python in your PC but you will be using an amazing python editor, Google Colab Visit https://t.co/EZt0agsdlV
This course is for anyone out there who is confused, frustrated, and just wants this python/finance thing to work!
In Module 1 of this Nano course, we will learn about :
# Using Google Colab
# Importing libraries
# Making a Random Time Series of Black Field Research Stock (fictional)
# Using Google Colab
Intro link is here on YT: https://t.co/MqMSDBaQri
Create a new Notebook at https://t.co/EZt0agsdlV and name it AnythingOfYourChoice.ipynb
You got your notebook ready and now the game is on!
You can add code in these cells and add as many cells as you want
# Importing Libraries
Imports are pretty standard, with a few exceptions.
For the most part, you can import your libraries by running the import.
Type this in the first cell you see. You need not worry about what each of these does, we will understand it later.