6 Free Tools and Platforms Every Day-Trader Should Be Using!
Why pay, when they are available for FREE?
More from Indrazith Shantharaj
Please read the FIRST Thread Before Reading this!
https://t.co/IV1HrDlzqk
#StockMarket #stock #volumeintrading
VOLUME is the ultimate Trading cheat code.
— Indrazith Shantharaj (@indraziths) August 6, 2022
But, most people never use it in the right way \u2013 because no one ever taught them how.
Here are 10 psychological triggers to knowing Volume in a better way :
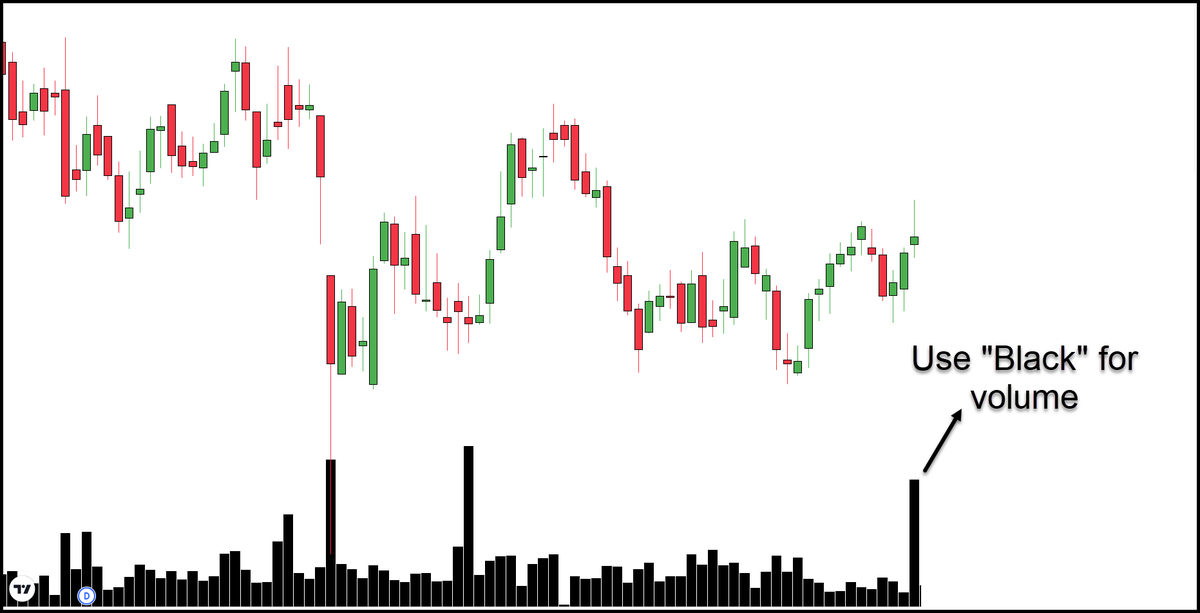
#1 Volume Color Can Create a False Illusion
At first look, it looks like a big volume spike.
But if you notice the price candle, it has a big selling wick.
It indicates "SELLING PRESSURE" is high at that time.

We can easily avoid this false impression using the "BLACK" color code across all the volume bars.
Now your mind doesn't assume it is a bullish volume spike!
(If you don't want to use the black color, then view the chart without getting any bias based on the volume color)
#2 Analyze Each Volume Spike Carefully
In this image, the price is breaking the resistance trendline.
How do you say whether it is a genuine breakout or false breakout (from a volume perspective)?

Observe the major Volume Spikes.
A is Bullish (Price moved upside on the next day)
B is Bearish (Price fell on the next day)
C is Bearish (Price moved sideways and fell)
D is Bearish (Price fell on the next day)
So High Probability of FALSE BREAKOUT!


More from Stockslearnings


Thread's on:
• How to find targets and exit criteria?
• Shanon's Demon (Investing)
• Tradingview scanner- Intraday/BTST
• 90-degree angle inflection point for profit-booking
• Importance of Leverage
Other cool tweets as well.
🧵Shannon's Demon - an investing "thought exercise"
This account writes the best threads, if you like the threads I make, you will surely love this account. Must
1/
— 10-K Diver (@10kdiver) October 23, 2021
Get a cup of coffee.
In this thread, I'll walk you through Shannon's Demon.
This is an investing "thought exercise" -- posed by the great scientist Claude Shannon.
Solving this exercise can teach us a lot about favorable vs unfavorable long-term bets, position sizing, etc.
🧵Finding expected targets and exit criteria to look for to exit the
How to find out the expected targets and what should be the exit criteria when you enter a trade - \U0001f9f5
— Sheetal Rijhwani (@RijhwaniSheetal) October 25, 2021
Possible ways to find out the target:
Check if any patterns forming - it gets quite easy to figure out the targets that way. (1/15)
🧵Trading View Scanner process to trade in momentum stocks.
Trading view scanner process -
— Vikrant (@Trading0secrets) October 23, 2021
1 - open trading view in your browser and select stock scanner in left corner down side .
2 - touch the percentage% gain change ( and u can see higest gainer of today) https://t.co/GGWSZXYMth
🧵90-degree angle inflection point for
The 90 degree angle inflection point in a stock is a signal to book profit
— Nikita Poojary (@niki_poojary) October 24, 2021
Lets understand with a recent example of a stock #IRCTC \U0001f683\U0001f68b
Time for a thread\U0001f9f5