Trading on chart patterns is difficult, Until you read this ! ⚡️
Everything about Head and Shoulder Pattern
Free Technical Analysis course (4/10) 🧵
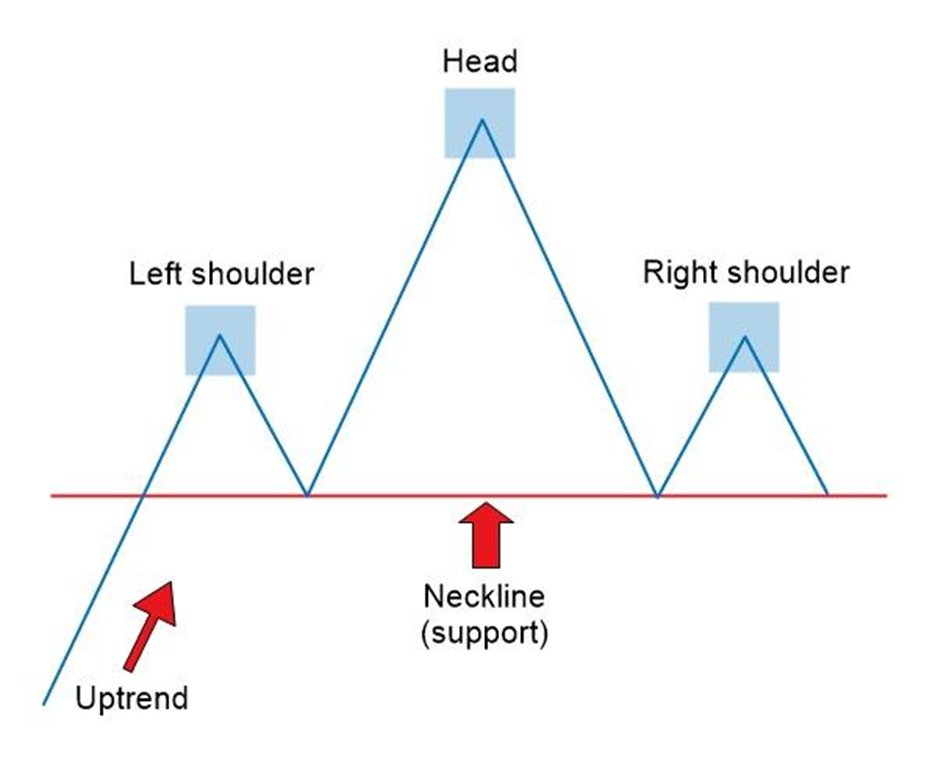
A head and shoulders (H&S) pattern is a chart pattern of three peaks, where the outer two are close in height, and the middle is the highest.
It is one of several top patterns that signal an upward trend is nearing its end.
How do we trade the H&S pattern?
We find out stock that has the pattern but has not given a breakdown below the support or neckline which means it is in the formation of the right shoulder.
Generally, we track the stock just before the breakout so that we don't miss a big move.
What does this mean?
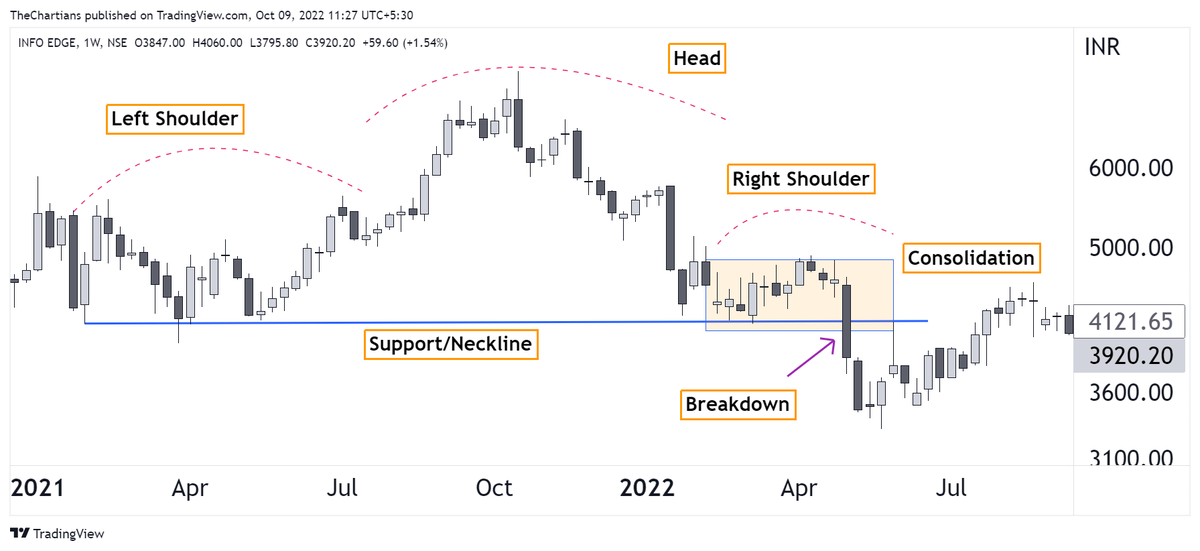
Basically, we look out for the charts where the price is forming the right shoulder or consolidating just above the neckline.
As seen in the chart where the price was in consolidation just above the resistance before the breakdown and big downmove.
Now the most important question is how we trade this pattern?
1. First identify stocks that are forming the H&S pattern and are about to give a breakdown.
2. Stoploss would be the nearest swing high or right shoulder high.