->Moreover you would find, Price goes near a level and stick to it or sustains there, in almost all cases it’s gonna big trending day.
How do I approach and trade?
-> Draw lines at Daily, weekly swing High & Low
-> Draw lines at hours resistance & Support
-> Now Check the trend on daily and hourly and board trade with 20% Capital size naked with Sl.
-> Either Sl or favour move.
->Moreover you would find, Price goes near a level and stick to it or sustains there, in almost all cases it’s gonna big trending day.
-> If there is rejection, then trades accordingly.
-> If comes into favour, I ll exit at predefined calculated targets as per Eliot wave, Pivots, Price action you can follow anything, results are almost same.
https://t.co/9g7YUDIafa https://t.co/vcxXsVhcqZ
Don't memorize patterns, candlesticks, and etc
— Namrata (@Chartsbank) July 5, 2020
If you want to get better at this gam,ask yourself
What are traders on the sideline thinking?
Where will other traders get trapped?
Where\u2019s the path of least resistance?
Where will new players enter?
Where will losers cut loss?
https://t.co/aacqojiG06 https://t.co/RxZf9Mh1ln
All newbie must go this link to understand markets psychology...https://t.co/LUiQpEBOhp
— Namrata (@Chartsbank) July 29, 2020
How to trade options?
— Namrata (@Chartsbank) August 1, 2020
-> Options can be traded via bias only.
Either Bullish, bearish, Neutral or mild bullish/ bearish.
Now its turn how to play that bias.
1. Now let me tell, when you expecting market to go up
How to play that.
One must do Performance review on monthly basis. As per me,it should not b done that you earned 'X' amount this month or last month 'Y' ...rather it should b like this \u27a1
— Namrata (@Chartsbank) August 2, 2020
If a person taking risk of 10K , if he is making 5-7K per trade then it doesn't make sense.
Everyone talks about market Psychology.
— Namrata (@Chartsbank) August 7, 2020
What actually mean it?
Does big boys consistent traders do really hv a different psychology?
If Yes, then How?
Let me cover what I personally do when I encountered with SL hit.
— Namrata (@Chartsbank) August 19, 2020
-> When my stops are hit and I take a loss, I stand back and review the market action for two possibilities:
What is #Trend
Does it hv #Momentum
Isn’t it #Over_bought_sold
Does #Volume supporting move
If options writing then view on #Volatity
Once you know these 5 things, make a system around this and you are done ✅
Next time when you ll see same pattern, you ll recall and say ...ohh yeah ..last time happened so & so..
Money is made this way only for me.
-> Let it come S/R or mean reversion
-> Wait for Entry trigger
(a) Rejection Candle for Reversal
(b) Big body BO candle
-> Hold till it reaches another Demand/Supply zone.
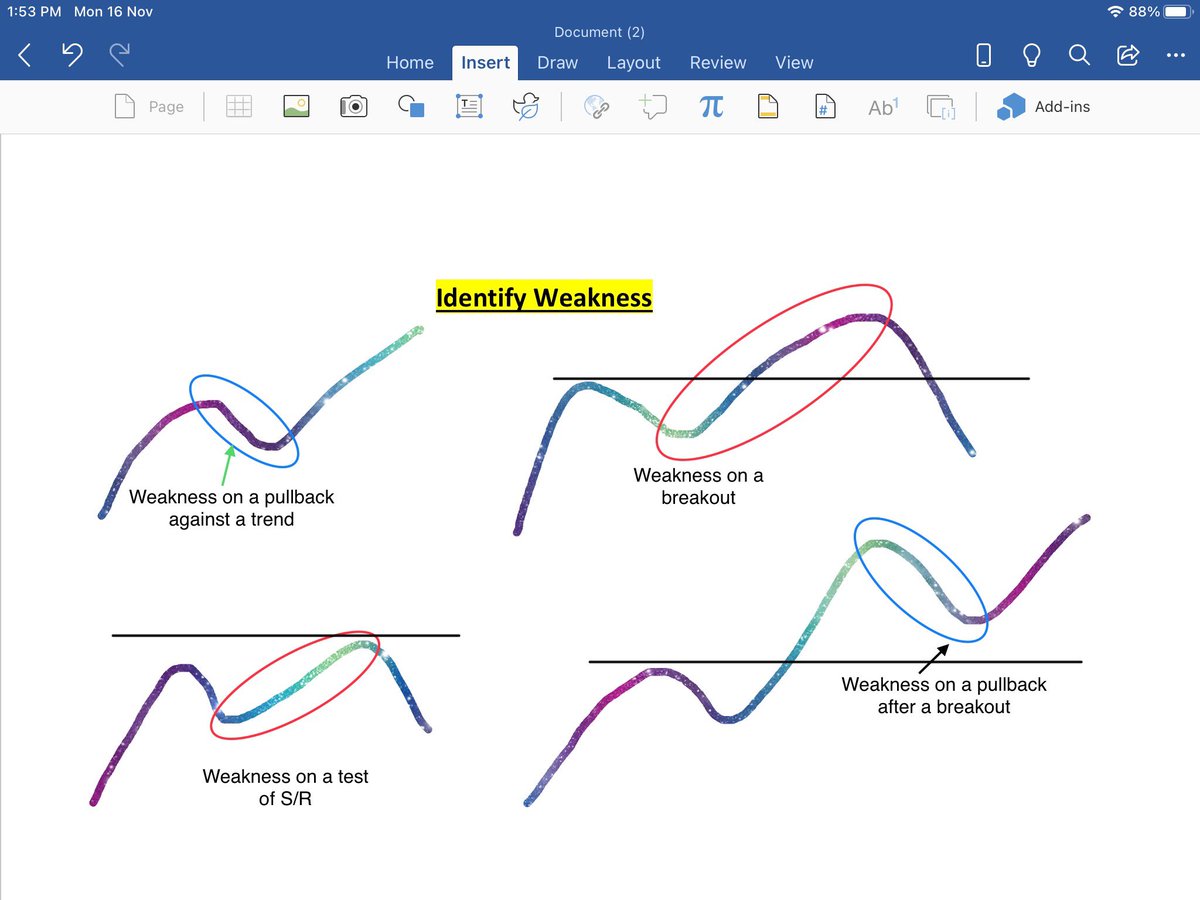

That’s it.
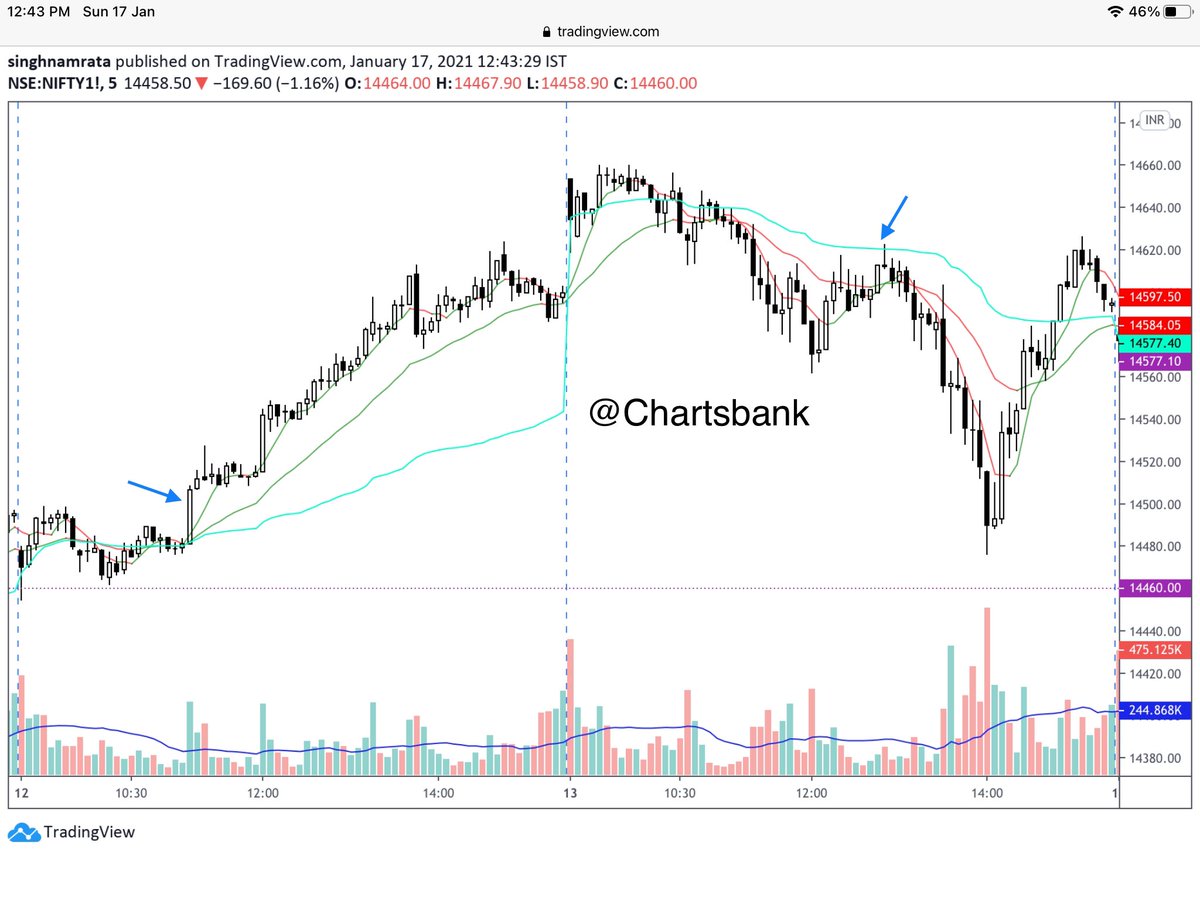
If it trades above this, my view is bullish or vice versa.
-> After Big candle
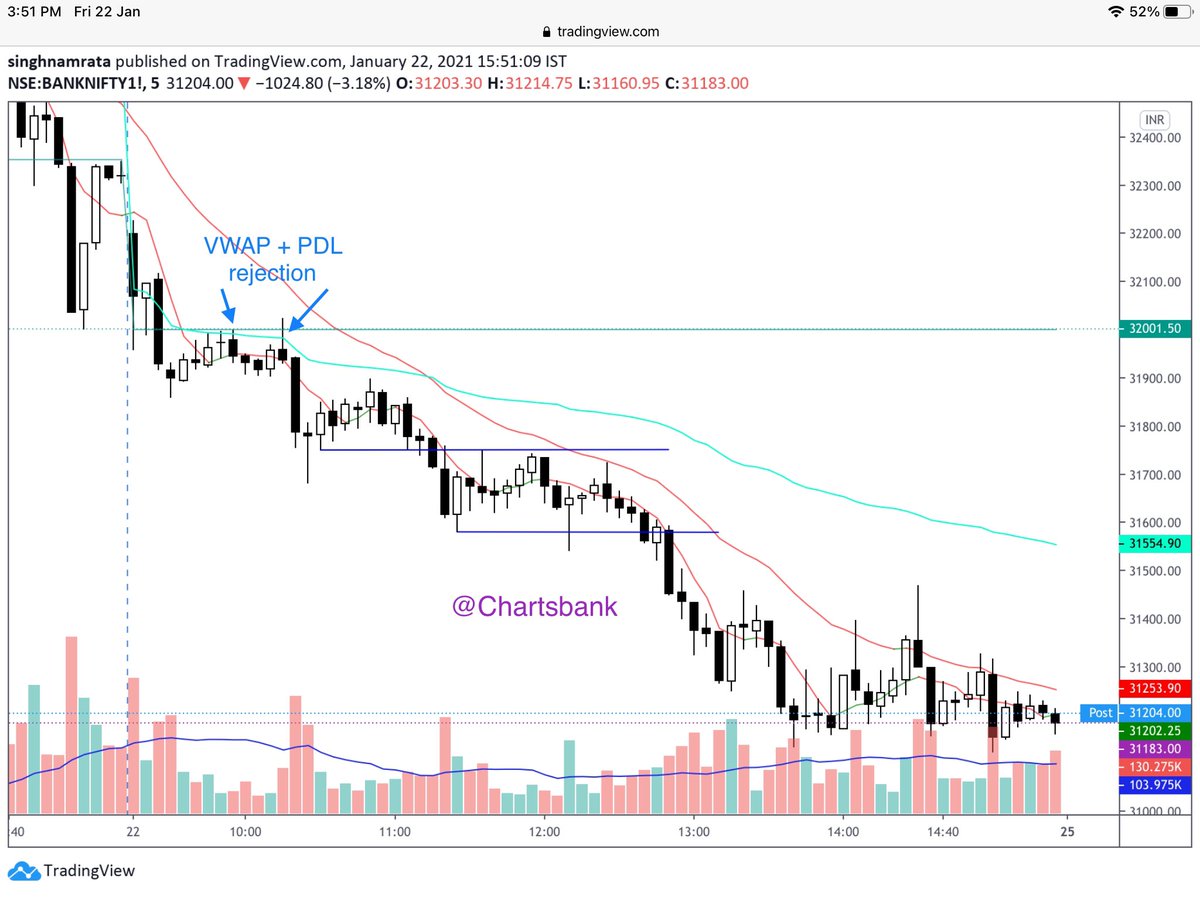
-> I scale in once price retraces to VWAP & make pin bars with Sl at other end.
PDL broken & rejection at VWAP making pin bar.
Sl is another End of pin bar.
Let\u2019s learn the divergence.
— Namrata (@Chartsbank) January 24, 2021
Whenever I teach, my moto is to make u master in that. U should get something new to learn even though when u already know that thing.
Divergence:- When price is not synchronised with the oscillator then the divergens occurs means

More from Stocklearnings

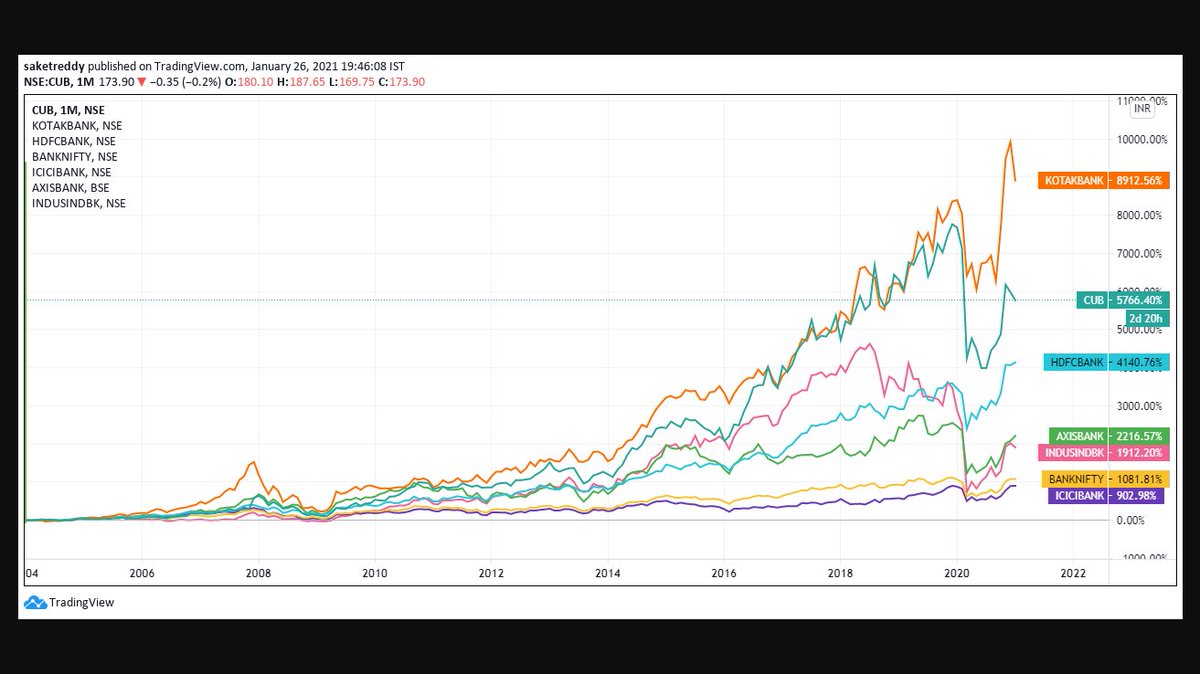
While people were debating figuring out which is the best in ICICI/AXIS & INDUSINDBNK, look what the top 3 high quality banks (HDFCBANK, KOTAKBANK & CUB) have done over the last 5, 10 & 17 years.
They are the real compounders, they've created massive wealth compared to others! https://t.co/PluVwU5OXG
They are the real compounders, they've created massive wealth compared to others! https://t.co/PluVwU5OXG
Hope Everyone saw BANDHANBNK Numbers. I feel many such banks will go through a massive NPA Cycle followed by depleted Tier 1.
— Saket Reddy (@saketreddy) January 24, 2021
Hence, stay with the Top 3 banks :-
HDFCBANK
KOTAKBANK
CUB
They've low cost of funding, well provisioned Moratorium book, high ROEs & high Tier 1 CAR.


All of my teachings in this thread:
At this point, I will just add them randomly but when they are complete I will structuralize them
The value you will find here is 🔥
1) Market
At this point, I will just add them randomly but when they are complete I will structuralize them
The value you will find here is 🔥
1) Market
Market Structure (MS)
— J A C K I S (@jackis_trader) July 6, 2020
Understanding MS is the most important thing in TA
It rules above everything. TL's, MA's, Indicators. Everything.
While it's nothing more than looking at swings and seeing Higher Highs (HH), Highers Lows (HL), Lower Highs (LH), and Lower Lows (LL). pic.twitter.com/QbgOSHGkBr


You May Also Like


Trading view scanner process -
1 - open trading view in your browser and select stock scanner in left corner down side .
2 - touch the percentage% gain change ( and u can see higest gainer of today)
3. Then, start with 6% gainer to 20% gainer and look charts of everyone in daily Timeframe . (For fno selection u can choose 1% to 4% )
4. Then manually select the stocks which are going to give all time high BO or 52 high BO or already given.
5. U can also select those stocks which are going to give range breakout or already given range BO
6 . If in 15 min chart📊 any stock sustaing near BO zone or after BO then select it on your watchlist
7 . Now next day if any stock show momentum u can take trade in it with RM
This looks very easy & simple but,
U will amazed to see it's result if you follow proper risk management.
I did 4x my capital by trading in only momentum stocks.
I will keep sharing such learning thread 🧵 for you 🙏💞🙏
Keep learning / keep sharing 🙏
@AdityaTodmal
1 - open trading view in your browser and select stock scanner in left corner down side .
2 - touch the percentage% gain change ( and u can see higest gainer of today)
Making thread \U0001f9f5 on trading view scanner by which you can select intraday and btst stocks .
— Vikrant (@Trading0secrets) October 22, 2021
In just few hours (Without any watchlist)
Some manual efforts u have to put on it.
Soon going to share the process with u whenever it will be ready .
"How's the josh?"guys \U0001f57a\U0001f3b7\U0001f483
3. Then, start with 6% gainer to 20% gainer and look charts of everyone in daily Timeframe . (For fno selection u can choose 1% to 4% )
4. Then manually select the stocks which are going to give all time high BO or 52 high BO or already given.
5. U can also select those stocks which are going to give range breakout or already given range BO
6 . If in 15 min chart📊 any stock sustaing near BO zone or after BO then select it on your watchlist
7 . Now next day if any stock show momentum u can take trade in it with RM
This looks very easy & simple but,
U will amazed to see it's result if you follow proper risk management.
I did 4x my capital by trading in only momentum stocks.
I will keep sharing such learning thread 🧵 for you 🙏💞🙏
Keep learning / keep sharing 🙏
@AdityaTodmal