Some people in this country are sincerely confused to hear people talk about “white supremacy” in conjunction with politics in America today. At the same time, a lot of people, both openly and in private, have consternation about changing demographics in America.
Let me explain.
More from TheValuesVoter
The more whiny Trump cries, whines and lies about the election, the more I’ll show research that shows that he lost and exactly why he lost.
Note to Trump supporters asking “why do you keep bringing him up?” Easy answer: he won’t shut his lying pie hole.
This is HOW he lost.
And this is HOW he lost.
He lost a lot of the white voters, college educated voters and independents who supported him in 2016.
In 2016, Donald Trump won Independents in every one of the six states that he flipped from blue to red.
In 2020, Donald Trump lost Independents in every one of the five states that Joe Biden flipped from red to blue.
Is it somehow strange that Trump lost the election? No. It would have been much stranger had Trump managed to win the election.
No one as consistently unpopular as him has ever been re-elected. Like ever.

Note to Trump supporters asking “why do you keep bringing him up?” Easy answer: he won’t shut his lying pie hole.
This is HOW he lost.
Okay, so here is a more complete rundown of how the last three Presidential Elections went down. And some more mythbusting of Trump's lies about the 2020 Election. https://t.co/3M9c79wHop pic.twitter.com/eRNRKQZzzB
— TheValuesVoter (@TheValuesVoter) May 1, 2021
And this is HOW he lost.
He lost a lot of the white voters, college educated voters and independents who supported him in 2016.
So here, in charts and tables, are the exit polls for the five states that flipped in the 2020 election.
— TheValuesVoter (@TheValuesVoter) May 15, 2021
Arizona - the trend of the state (clearly trending toward the Dems after 2012) and the groups Trump improved/declined with between 2016, when he won and 2020, when he lost. pic.twitter.com/ZxUXyui83R
In 2016, Donald Trump won Independents in every one of the six states that he flipped from blue to red.
In 2020, Donald Trump lost Independents in every one of the five states that Joe Biden flipped from red to blue.
Is it somehow strange that Trump lost the election? No. It would have been much stranger had Trump managed to win the election.
No one as consistently unpopular as him has ever been re-elected. Like ever.

More from Society


Krugman is, of course, right about this. BUT, note that universities can do a lot to revitalize declining and rural regions.
See this thing that @lymanstoneky wrote:
And see this thing that I wrote:
And see this book that @JamesFallows wrote:
And see this other thing that I wrote:
One thing I've been noticing about responses to today's column is that many people still don't get how strong the forces behind regional divergence are, and how hard to reverse 1/ https://t.co/Ft2aH1NcQt
— Paul Krugman (@paulkrugman) November 20, 2018
See this thing that @lymanstoneky wrote:
And see this thing that I wrote:
And see this book that @JamesFallows wrote:
And see this other thing that I wrote:


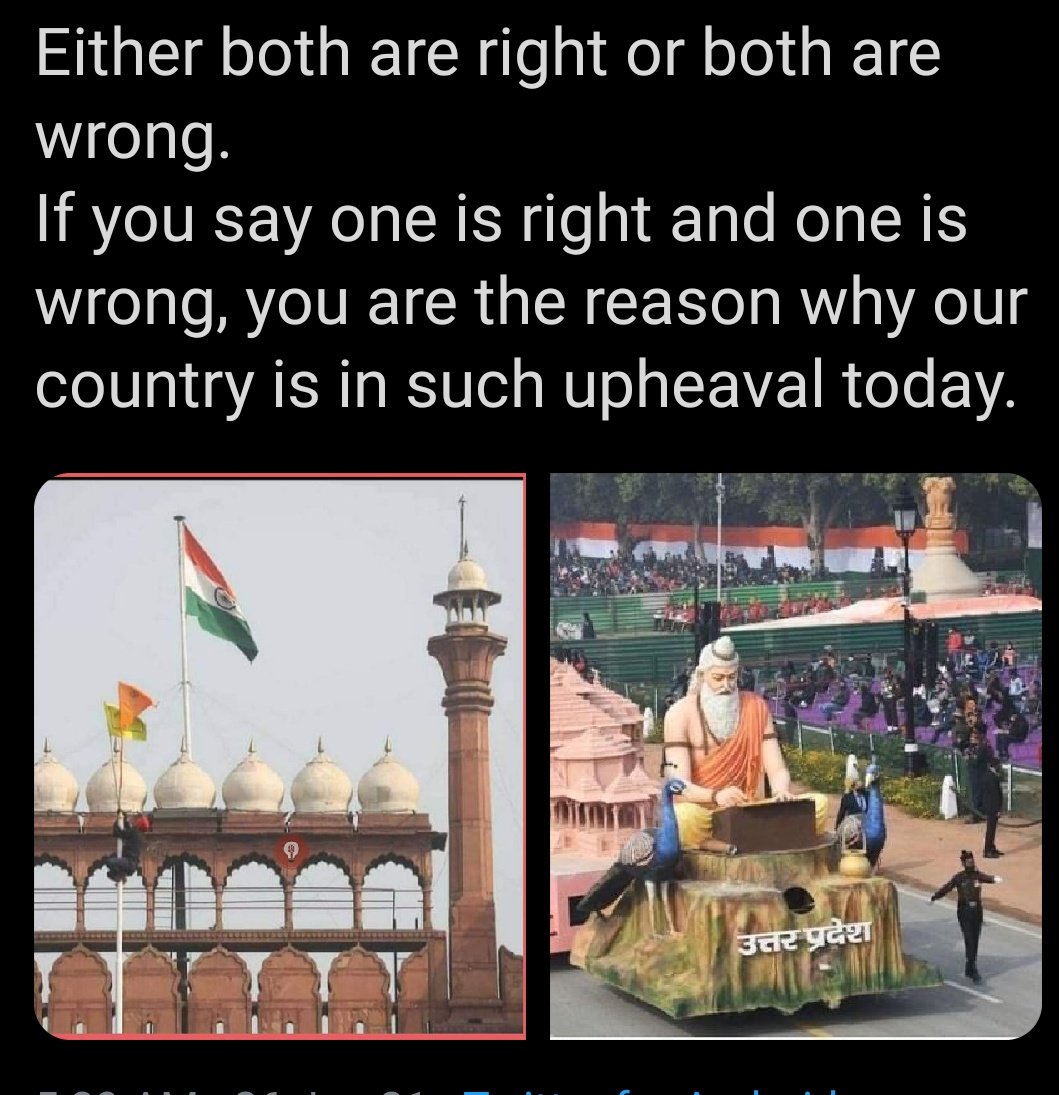

Patriotism is an interesting concept in that it’s excepted to mean something positive to all of us and certainly seen as a morally marketable trait that can fit into any definition you want for it.+
Tolstoy, found it both stupid and immoral. It is stupid because every patriot holds his own country to be the best, which obviously negates all other countries.+
It is immoral because it enjoins us to promote our country’s interests at the expense of all other countries, employing any means, including war. It is thus at odds with the most basic rule of morality, which tells us not to do to others what we would not want them to do to us+
My sincere belief is that patriotism of a personal nature, which does not impede on personal and physical liberties of any other, is not only welcome but perhaps somewhat needed.
But isn’t adherence to a more humane code of life much better than nationalistic patriotism?+
Göring said, “people can always be brought to the bidding of the leaders. That is easy. All you have to do is tell them they are being attacked, and denounce the peacemakers for lack of patriotism and exposing the country to danger. It works the same in any country.”+
\u0926\u0947\u0936 \u092e\u0947\u0902 \u092a\u0939\u0932\u0940 \u092c\u093e\u0930 \U0001f1ee\U0001f1f3
— AAP (@AamAadmiParty) March 12, 2021
\u0926\u0947\u0936\u092d\u0915\u094d\u0924\u093f \u0915\u0940 \u0938\u094d\u092a\u0947\u0936\u0932 \u0915\u094d\u0932\u093e\u0938 \u0932\u0917\u093e\u090f\u0917\u0940 @ArvindKejriwal \u0938\u0930\u0915\u093e\u0930\u0964
\u090f\u0915 \u092a\u093e\u0920\u094d\u092f\u0915\u094d\u0930\u092e \u092c\u0928\u093e\u092f\u093e \u091c\u093e\u090f\u0917\u093e, \u091c\u093f\u0938\u0938\u0947 \u092c\u091a\u094d\u091a\u094b\u0902 \u092e\u0947\u0902 \u0915\u0942\u091f \u0915\u0942\u091f \u0915\u0930 \u0926\u0947\u0936\u092d\u0915\u094d\u0924\u093f \u092d\u0930\u0940 \u091c\u093e\u090f\u0917\u0940\u0964 pic.twitter.com/iO6WMBh4YG
Tolstoy, found it both stupid and immoral. It is stupid because every patriot holds his own country to be the best, which obviously negates all other countries.+
It is immoral because it enjoins us to promote our country’s interests at the expense of all other countries, employing any means, including war. It is thus at odds with the most basic rule of morality, which tells us not to do to others what we would not want them to do to us+
My sincere belief is that patriotism of a personal nature, which does not impede on personal and physical liberties of any other, is not only welcome but perhaps somewhat needed.
But isn’t adherence to a more humane code of life much better than nationalistic patriotism?+
Göring said, “people can always be brought to the bidding of the leaders. That is easy. All you have to do is tell them they are being attacked, and denounce the peacemakers for lack of patriotism and exposing the country to danger. It works the same in any country.”+
You May Also Like


On the occasion of youtube 20k and Twitter 70k members
A small tribute/gift to members
Screeners
technical screeners - intraday and positional both
before proceeding - i have helped you , can i ask you so that it can help someone else too
thank you
positional one
run - find #stock - draw chart - find levels
1- Stocks closing daily 2% up from 5 days
https://t.co/gTZrYY3Nht
2- Weekly breakout
https://t.co/1f4ahEolYB
3- Breakouts in short term
https://t.co/BI4h0CdgO2
4- Bullish from last 5
intraday screeners
5- 15 minute Stock Breakouts
https://t.co/9eAo82iuNv
6- Intraday Buying seen in the past 15 minutes
https://t.co/XqAJKhLB5G
7- Stocks trading near day's high on 5 min chart with volume BO intraday
https://t.co/flHmm6QXmo
Thank you