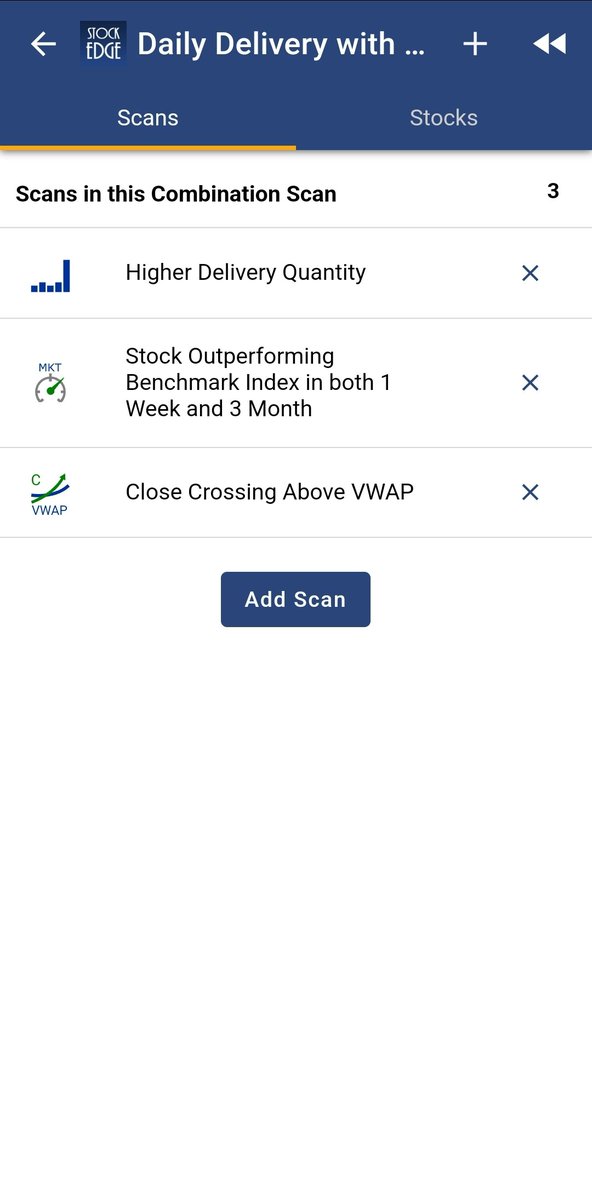
Detailed Study of Stocks that became 5X in past 2 Years
— JayneshKasliwal (@JayneshKasliwal) March 30, 2022
A Mega Thread\U0001f9f5
Concepts :
Relative Strength
Stage Analysis
Retweet and Comment If you want to attend a live session on the same ! pic.twitter.com/Gav5TkU0Qv
Some Facts About 5× Multibaggers of Last 2 years
1. From Around 80 Stocks filtered
66 Had Market Cap less than 2k Cr
2. All stocks min doubled before they entered Stage 2 Uptrend
And Many More intresting learnings
Comment "yes" if you want a thread with charts !
More from JayneshKasliwal

𝗛𝗼𝘄 𝘁𝗼 𝗰𝗿𝗲𝗮𝘁𝗲 𝘆𝗼𝘂𝗿 𝗼𝘄𝗻 𝗖𝗵𝗮𝗿𝘁𝗶𝗻𝗸 𝗦𝗰𝗿𝗲𝗲𝗻𝗲𝗿
🧵 Thread 🧵
[1/15]
𝗖𝗵𝗮𝗿𝘁𝗶𝗻𝗸 𝗦𝗰𝗿𝗲𝗲𝗻𝗲𝗿 is a Stock screening tool that is useful to screen stocks based on Technical & Fundamentals.
🔸 It scans stocks by using technical indicators like RSI, MACD, divergences, etc.
🔸 It also uses fundamental tools like Book Value, EPS,PE etc
[2/15]
How To Create A Scan ?
Go to https://t.co/JJEJBg3Cd8 & click on 𝘊𝘳𝘦𝘢𝘵𝘦 𝘚𝘤𝘢𝘯 under 𝘚𝘤𝘳𝘦𝘦𝘯𝘦𝘳𝘴.
[3/15]
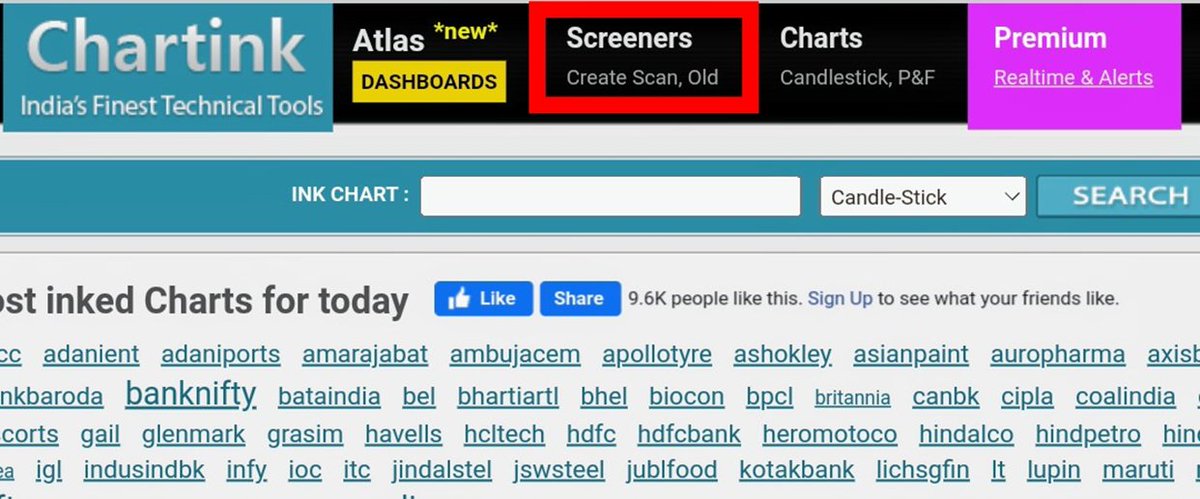
𝗙𝗶𝗿𝘀𝘁 𝗦𝘁𝗲𝗽 𝗧𝗼 𝗙𝗶𝗹𝘁𝗲𝗿 𝗦𝘁𝗼𝗰𝗸𝘀
We can select segments of stocks of our choice, e.g. cash or futures stocks, Nifty 100 etc.
Click on green ‘+’ icon to add conditions.
[4/15]

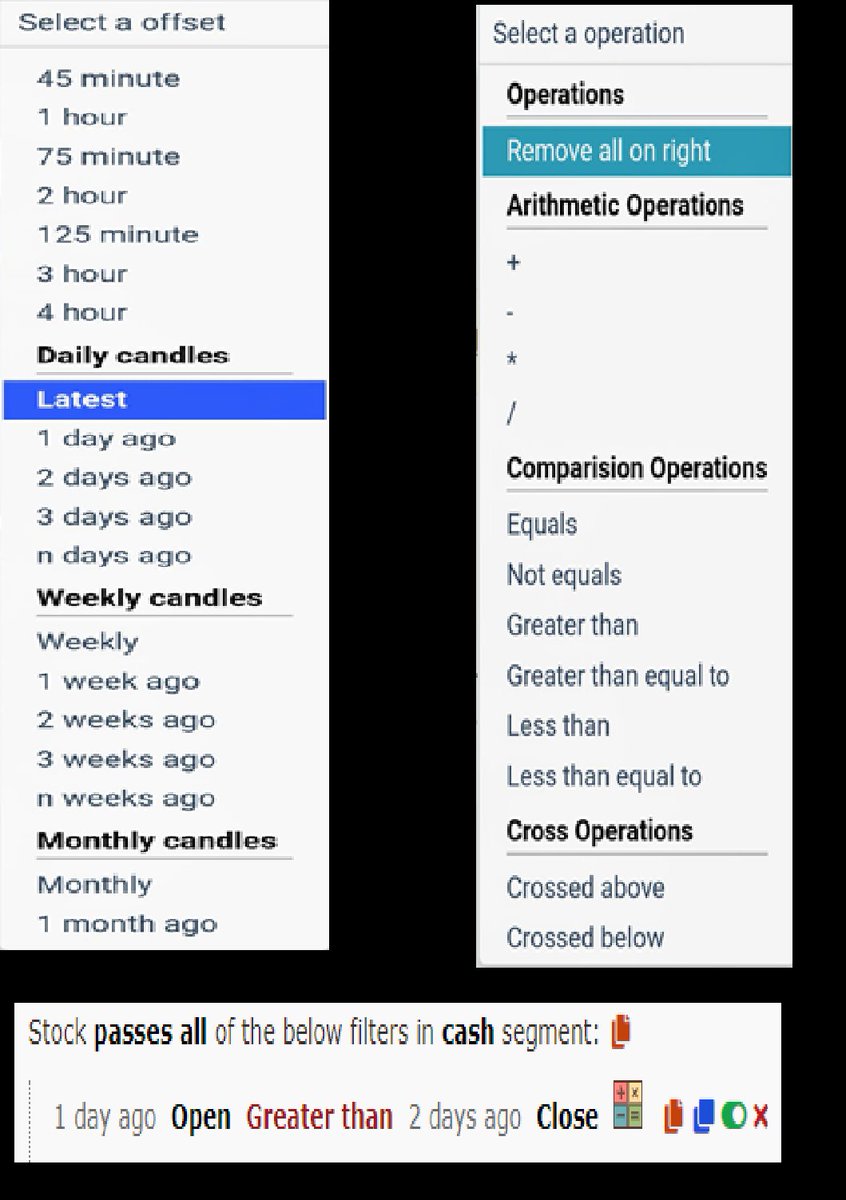
𝗖𝗮𝗻𝗱𝗹𝗲 𝗧𝗶𝗺𝗲𝗳𝗿𝗮𝗺𝗲𝘀 & 𝗖𝗼𝗺𝗽𝗮𝗿𝗶𝘀𝗼𝗻 𝗢𝗽𝗲𝗿𝗮𝘁𝗼𝗿𝘀🔸 We can select any timeframe of candles in Chartink, from minutes to years.
🔸 And compare two candles using comparison operators like 𝘌𝘲𝘶𝘢𝘭 𝘵𝘰 or 𝘎𝘳𝘦𝘢𝘵𝘦𝘳 𝘛𝘩𝘢𝘯 , crossovers etc
[5/15]
🧵 Thread 🧵
[1/15]
𝗖𝗵𝗮𝗿𝘁𝗶𝗻𝗸 𝗦𝗰𝗿𝗲𝗲𝗻𝗲𝗿 is a Stock screening tool that is useful to screen stocks based on Technical & Fundamentals.
🔸 It scans stocks by using technical indicators like RSI, MACD, divergences, etc.
🔸 It also uses fundamental tools like Book Value, EPS,PE etc
[2/15]
How To Create A Scan ?
Go to https://t.co/JJEJBg3Cd8 & click on 𝘊𝘳𝘦𝘢𝘵𝘦 𝘚𝘤𝘢𝘯 under 𝘚𝘤𝘳𝘦𝘦𝘯𝘦𝘳𝘴.
[3/15]
𝗙𝗶𝗿𝘀𝘁 𝗦𝘁𝗲𝗽 𝗧𝗼 𝗙𝗶𝗹𝘁𝗲𝗿 𝗦𝘁𝗼𝗰𝗸𝘀
We can select segments of stocks of our choice, e.g. cash or futures stocks, Nifty 100 etc.
Click on green ‘+’ icon to add conditions.
[4/15]
𝗖𝗮𝗻𝗱𝗹𝗲 𝗧𝗶𝗺𝗲𝗳𝗿𝗮𝗺𝗲𝘀 & 𝗖𝗼𝗺𝗽𝗮𝗿𝗶𝘀𝗼𝗻 𝗢𝗽𝗲𝗿𝗮𝘁𝗼𝗿𝘀🔸 We can select any timeframe of candles in Chartink, from minutes to years.
🔸 And compare two candles using comparison operators like 𝘌𝘲𝘶𝘢𝘭 𝘵𝘰 or 𝘎𝘳𝘦𝘢𝘵𝘦𝘳 𝘛𝘩𝘢𝘯 , crossovers etc
[5/15]
𝗡𝗶𝗳𝘁𝘆-𝗕𝗮𝗻𝗸𝗻𝗶𝗳𝘁𝘆 𝗢𝗽𝘁𝗶𝗼𝗻 𝗕𝘂𝘆𝗶𝗻𝗴 𝗦𝘁𝗿𝗮𝘁𝗲𝗴𝘆
Complete Backtest and Indicator link
🧵 A Thread 🧵
𝗦𝗲𝘁𝘂𝗽:
🔸 Monthly Option Buying
🔸 50 ema on 3 min timeframe
🔸 Supertrend 10 , 3
🔸 Chart : Banknifty , Nifty Futures as we backtested on futures
🔸 Entry 9:20 to 3:00
🔸 Max 3 Entries per day
🔸 Premium nearest to 200 Rs only
[2/18]
Why Monthly Option buying ?
🔸 Less theta decay compared to weekly options
🔸 Less Volatility
🔸 Supertrend and MA Settings
[3/18]

🔸 Indicator Link
🔸 Click on the below 𝘭𝘪𝘯𝘬 -> 𝘈𝘥𝘥 𝘵𝘰 𝘍𝘢𝘷𝘰𝘶𝘳𝘪𝘵𝘦𝘴 -> 𝘈𝘥𝘥 𝘰𝘯 𝘊𝘩𝘢𝘳𝘵 from favourites and start using it !
🔸 https://t.co/zVXavqLBto
[4/18]
𝗜𝗻𝗱𝗶𝗰𝗮𝘁𝗼𝗿 𝗦𝗲𝘁𝘁𝗶𝗻𝗴𝘀 :
🔸 Max 6 Trades per day ( Both CE and PE buy)
🔸 Timings 9:20 am to 3:00 pm
🔸 Supertrend : 10,3
🔸 Moving Average 50 ema
[5/18]

Complete Backtest and Indicator link
🧵 A Thread 🧵
𝗦𝗲𝘁𝘂𝗽:
🔸 Monthly Option Buying
🔸 50 ema on 3 min timeframe
🔸 Supertrend 10 , 3
🔸 Chart : Banknifty , Nifty Futures as we backtested on futures
🔸 Entry 9:20 to 3:00
🔸 Max 3 Entries per day
🔸 Premium nearest to 200 Rs only
[2/18]
Why Monthly Option buying ?
🔸 Less theta decay compared to weekly options
🔸 Less Volatility
🔸 Supertrend and MA Settings
[3/18]
🔸 Indicator Link
🔸 Click on the below 𝘭𝘪𝘯𝘬 -> 𝘈𝘥𝘥 𝘵𝘰 𝘍𝘢𝘷𝘰𝘶𝘳𝘪𝘵𝘦𝘴 -> 𝘈𝘥𝘥 𝘰𝘯 𝘊𝘩𝘢𝘳𝘵 from favourites and start using it !
🔸 https://t.co/zVXavqLBto
[4/18]
𝗜𝗻𝗱𝗶𝗰𝗮𝘁𝗼𝗿 𝗦𝗲𝘁𝘁𝗶𝗻𝗴𝘀 :
🔸 Max 6 Trades per day ( Both CE and PE buy)
🔸 Timings 9:20 am to 3:00 pm
🔸 Supertrend : 10,3
🔸 Moving Average 50 ema
[5/18]

I have designed many beginner to advanced
Option Strategies free of cost
Here is a thread of all 🧵
A Retweet would help :)
Begin Your Algo Trading Journey
https://t.co/xIA6SIgGRj
1/n

Banknifty Option Selling Strategy :
https://t.co/r6vxQY212o
2/n

Banknifty option Buying :
https://t.co/w3QukixFD2
3/n
Advanced Intraday Strangle :
https://t.co/v1KynrLb03
4/n

Option Strategies free of cost
Here is a thread of all 🧵
A Retweet would help :)
Begin Your Algo Trading Journey
https://t.co/xIA6SIgGRj
1/n
Banknifty Option Selling Strategy :
https://t.co/r6vxQY212o
2/n
Banknifty option Buying :
https://t.co/w3QukixFD2
3/n
Advanced Intraday Strangle :
https://t.co/v1KynrLb03
4/n
More from Screeners


So friends here is the thread on the recommended pathway for new entrants in the stock market.
Here I will share what I believe are essentials for anybody who is interested in stock markets and the resources to learn them, its from my experience and by no means exhaustive..
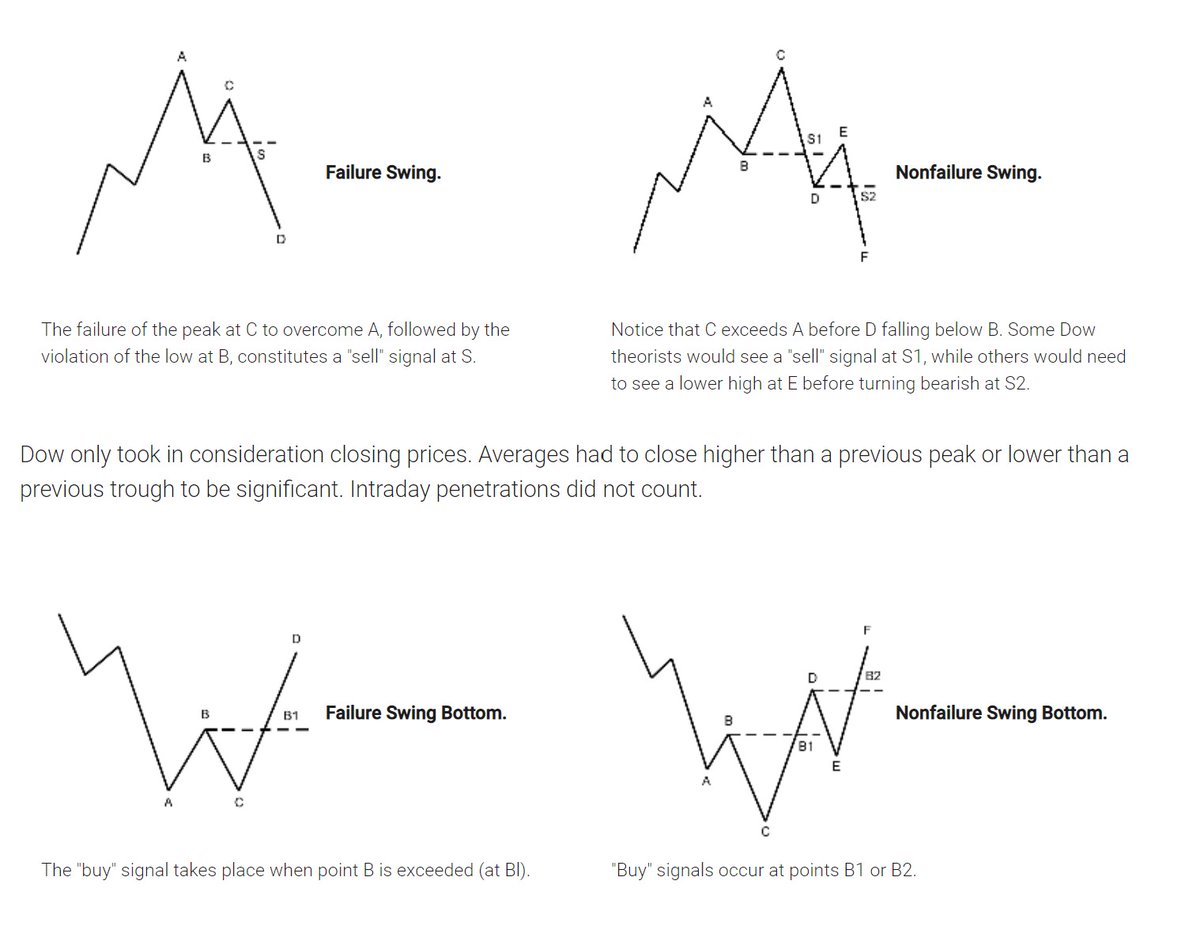
First the very basic : The Dow theory, Everybody must have basic understanding of it and must learn to observe High Highs, Higher Lows, Lower Highs and Lowers lows on charts and their
Even those who are more inclined towards fundamental side can also benefit from Dow theory, as it can hint start & end of Bull/Bear runs thereby indication entry and exits.
Next basic is Wyckoff's Theory. It tells how accumulation and distribution happens with regularity and how the market actually
Dow theory is old but
Here I will share what I believe are essentials for anybody who is interested in stock markets and the resources to learn them, its from my experience and by no means exhaustive..
First the very basic : The Dow theory, Everybody must have basic understanding of it and must learn to observe High Highs, Higher Lows, Lower Highs and Lowers lows on charts and their
Even those who are more inclined towards fundamental side can also benefit from Dow theory, as it can hint start & end of Bull/Bear runs thereby indication entry and exits.
Next basic is Wyckoff's Theory. It tells how accumulation and distribution happens with regularity and how the market actually
Dow theory is old but
Old is Gold....
— Professor (@DillikiBiili) January 23, 2020
this Bharti Airtel chart is a true copy of the Wyckoff Pattern propounded in 1931....... pic.twitter.com/tQ1PNebq7d