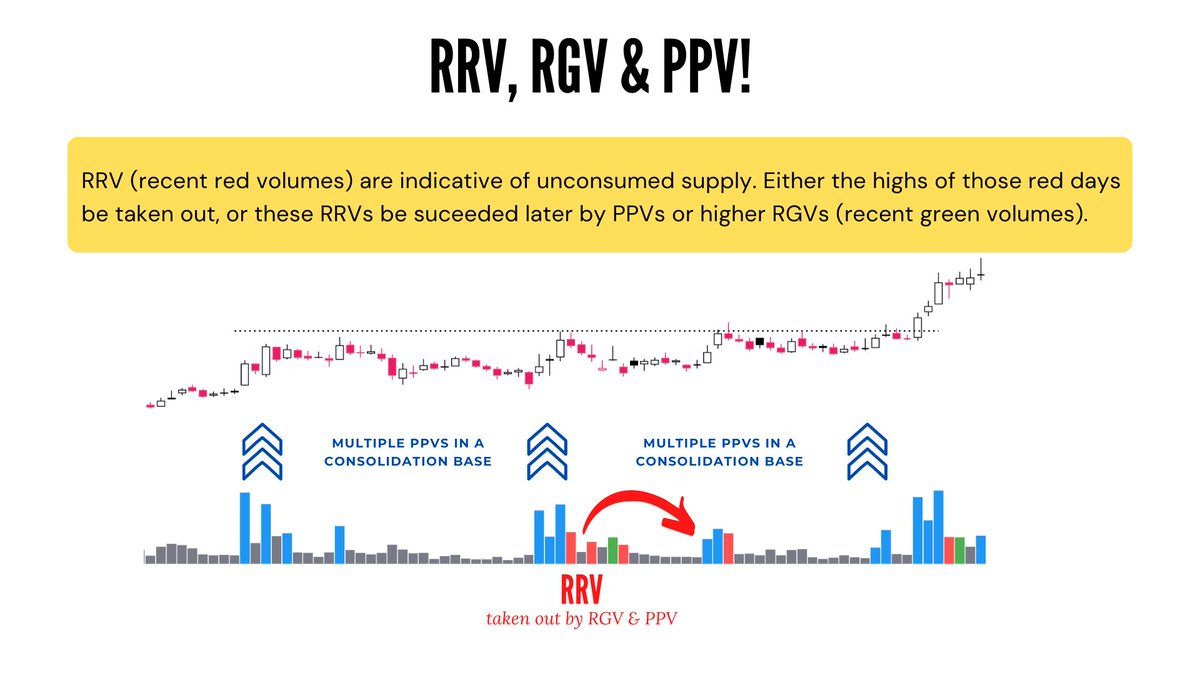
I try to look for exhaustion of supply, drying down of volumes, & narrowing of daily/weekly ranges. Enter after an upmove, on the lowest volume & the smallest daily range, as the stock forms a low volume doji/inside bar while in pullback/retest at/in/near the zone of 10MA & 20MA.
I m watching your posts... amazing sir.... thanks for sharing.... can you share what is your trade set up
— Sahasra (@h_shanmugavelu) March 21, 2022
More from Nitin


More from Screeners

Chartink Screeners Complete Compilation
Sharing 9 Screeners🧵
1. Swing Trading Techno Funda https://t.co/sV6e8XSFRK
2.Range Breakout
https://t.co/SNKEpGHNtv
3. Stocks in Tight Range :
https://t.co/MqDFMEfj82
Telegram Link : https://t.co/b4N4oPjqm9
Retweet and Share !
4.Stock Closing up 3% Since 3 days
https://t.co/vLGG9k3YKz
5. Close above 21 ema
https://t.co/fMZkgLczxR
6. Days Fall and Reversal
7. 52 WEEK high Stocks.
https://t.co/H6Z6IGMRwS
8. Intraday Stocks :https://t.co/JoXYRcogj7
9. Darvas Box


And here it is:
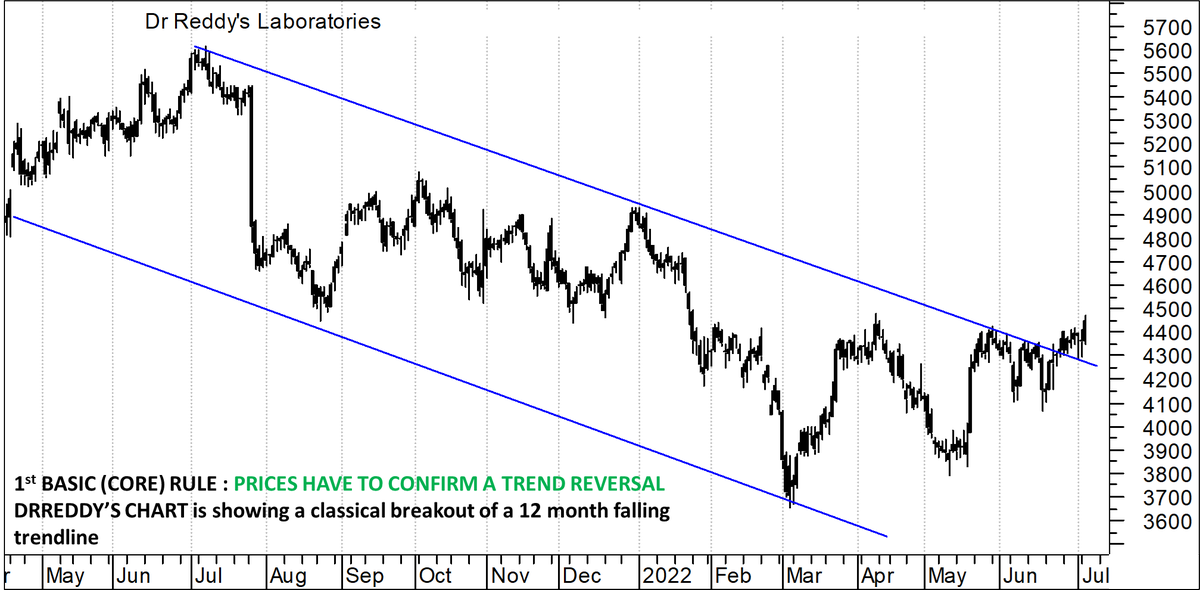
The 3 most important rules which I follow in spotting a major trend reversal laid out in this stock, 'as it is'.
1. Trend reversal
2. Price patterns
3. Indicator confirmation
Perfect TA chart.
All boxes ticked !!
Do comment, like and share !!!
#DRREDDY https://t.co/4JGg71GenE
The 3 most important rules which I follow in spotting a major trend reversal laid out in this stock, 'as it is'.
1. Trend reversal
2. Price patterns
3. Indicator confirmation
Perfect TA chart.
All boxes ticked !!
Do comment, like and share !!!
#DRREDDY https://t.co/4JGg71GenE
Today at 2 pm:
— Kunal Bothra (@kbbothra) July 5, 2022
I will bring to you one of the SUPER FINEST TECHNICAL CHART setup on a largecap name.
Agar yeh nahi chal paya toh kuch nahi chal paayega\u2026
Retweeet tsunami has to come for this one\u2026 #stock #breakout #technical

You May Also Like

Speech Delay is most common in children nowadays
In ancient times, our grandparents used to follow typical natural way of caring the needs of a child. All they used were more of natural products than chemical based for the growth of child.

One of major step followed was to feed Gurbach Jadd/ Vasa Kommu/ Acorus Calamus for initiating good speech ability in a child. This stem was needed to babies on Tuesdays and Sundays in mother's milk.
Vasa is feed to baby after the 1st bath on 12th day in week. Weekly only thrice it is fed and named as :
Budhwar - Budhi Vasa
Mangalwar - Vaak Vasa
Ravi Vaar - Aayush Vasa
This stem is burnt and rubbed against the grinding stone in mother's milk or warm water to get a paste
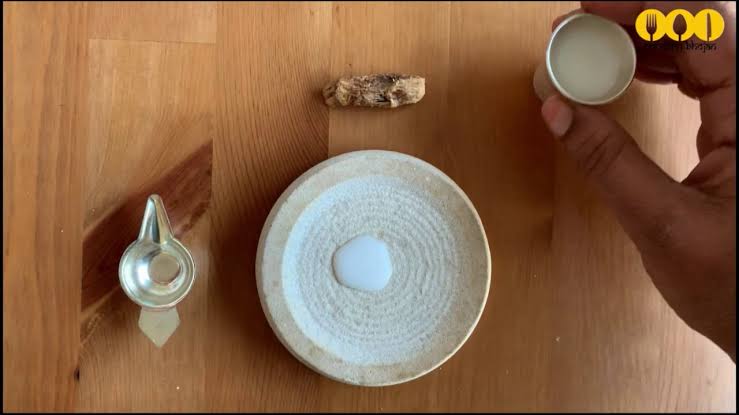
The procedure to make it is in the link
https://t.co/uo4sGp7mUm
It should not be given daily to the child. Other main benefits are
1. It clears the phlegm in child's throat caused due to continuous milk intake. It clears the tracts and breathing is effortless.
2. Digestion
For children who haven't got their speech and is delayed than usual should feed this vasa on these days in week atleast for 6months. Don't get carried away with this dialogue
"Some gain speech little late"
In ancient times, our grandparents used to follow typical natural way of caring the needs of a child. All they used were more of natural products than chemical based for the growth of child.
One of major step followed was to feed Gurbach Jadd/ Vasa Kommu/ Acorus Calamus for initiating good speech ability in a child. This stem was needed to babies on Tuesdays and Sundays in mother's milk.
Vasa is feed to baby after the 1st bath on 12th day in week. Weekly only thrice it is fed and named as :
Budhwar - Budhi Vasa
Mangalwar - Vaak Vasa
Ravi Vaar - Aayush Vasa
This stem is burnt and rubbed against the grinding stone in mother's milk or warm water to get a paste
The procedure to make it is in the link
https://t.co/uo4sGp7mUm
It should not be given daily to the child. Other main benefits are
1. It clears the phlegm in child's throat caused due to continuous milk intake. It clears the tracts and breathing is effortless.
2. Digestion
For children who haven't got their speech and is delayed than usual should feed this vasa on these days in week atleast for 6months. Don't get carried away with this dialogue
"Some gain speech little late"