
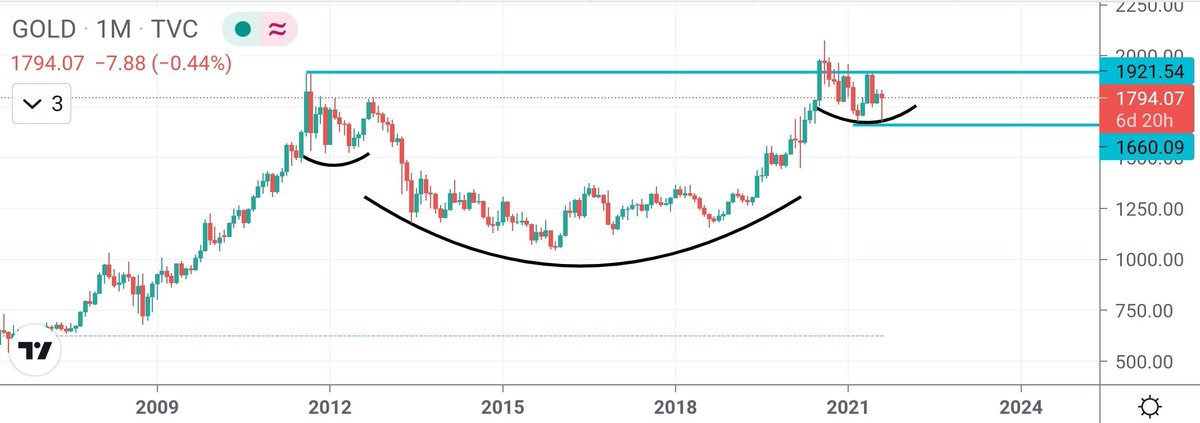
DXY and commodities usually don't move in the same direction.
One of them has to give-in.
My money (not literally) is on commodities reversal in near future.
Even in the past, whenever the inverse relationship appeared to be broken, it always resolved in the favour of USD.
More from Mayank Narula

More from Screeners


On the occasion of youtube 20k and Twitter 70k members
A small tribute/gift to members
Screeners
technical screeners - intraday and positional both
before proceeding - i have helped you , can i ask you so that it can help someone else too
thank you
positional one
run - find #stock - draw chart - find levels
1- Stocks closing daily 2% up from 5 days
https://t.co/gTZrYY3Nht
2- Weekly breakout
https://t.co/1f4ahEolYB
3- Breakouts in short term
https://t.co/BI4h0CdgO2
4- Bullish from last 5
intraday screeners
5- 15 minute Stock Breakouts
https://t.co/9eAo82iuNv
6- Intraday Buying seen in the past 15 minutes
https://t.co/XqAJKhLB5G
7- Stocks trading near day's high on 5 min chart with volume BO intraday
https://t.co/flHmm6QXmo
Thank you


Oil, copper and other commodities came under heavy selling pressure today and that's a good thing because it's mounting evidence that inflation may be peaking.
Positive signs on inflation include fertilizer prices peaking and trending downward. Used Car prices are also down (which led inflation). The recent price break on the $XLE - which emerged almost to the day the market topped, could be an indication that we are close to a low. pic.twitter.com/2MtcKjjmAz
— Mark Minervini (@markminervini) June 23, 2022

You May Also Like


And here they are...
THE WINNERS OF THE 24 HOUR STARTUP CHALLENGE
Remember, this money is just fun. If you launched a product (or even attempted a launch) - you did something worth MUCH more than $1,000.
#24hrstartup
The winners 👇
#10
Lattes For Change - Skip a latte and save a life.
https://t.co/M75RAirZzs
@frantzfries built a platform where you can see how skipping your morning latte could do for the world.
A great product for a great cause.
Congrats Chris on winning $250!
#9
Instaland - Create amazing landing pages for your followers.
https://t.co/5KkveJTAsy
A team project! @bpmct and @BaileyPumfleet built a tool for social media influencers to create simple "swipe up" landing pages for followers.
Really impressive for 24 hours. Congrats!
#8
SayHenlo - Chat without distractions
https://t.co/og0B7gmkW6
Built by @DaltonEdwards, it's a platform for combatting conversation overload. This product was also coded exclusively from an iPad 😲
Dalton is a beast. I'm so excited he placed in the top 10.
#7
CoderStory - Learn to code from developers across the globe!
https://t.co/86Ay6nF4AY
Built by @jesswallaceuk, the project is focused on highlighting the experience of developers and people learning to code.
I wish this existed when I learned to code! Congrats on $250!!