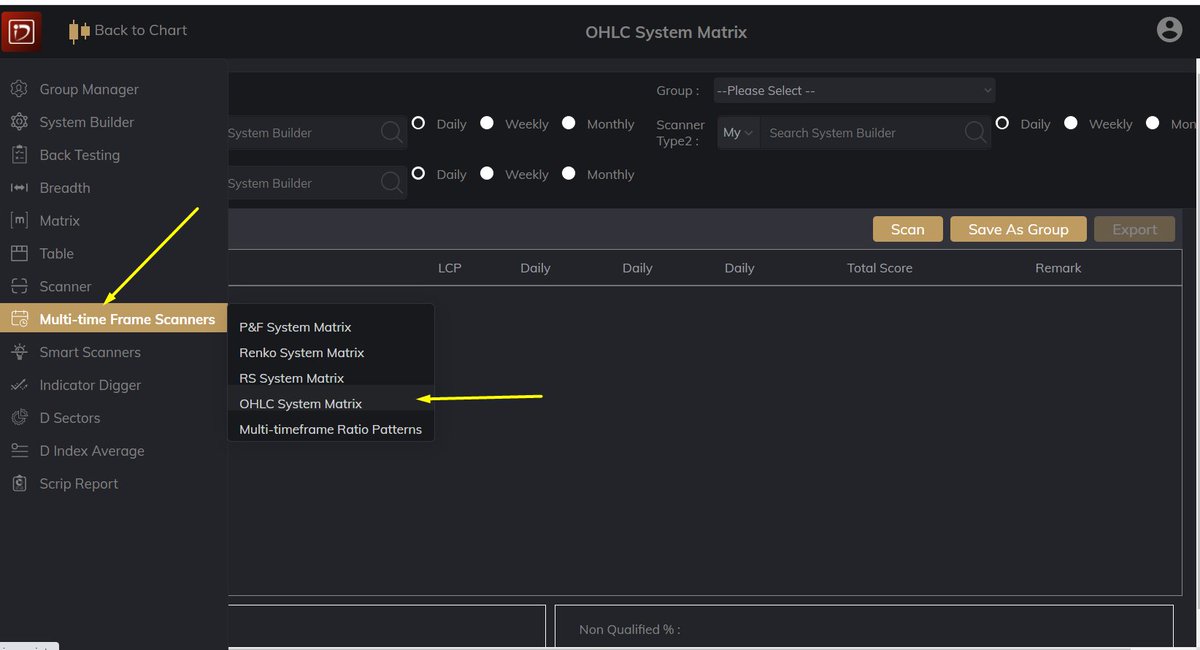
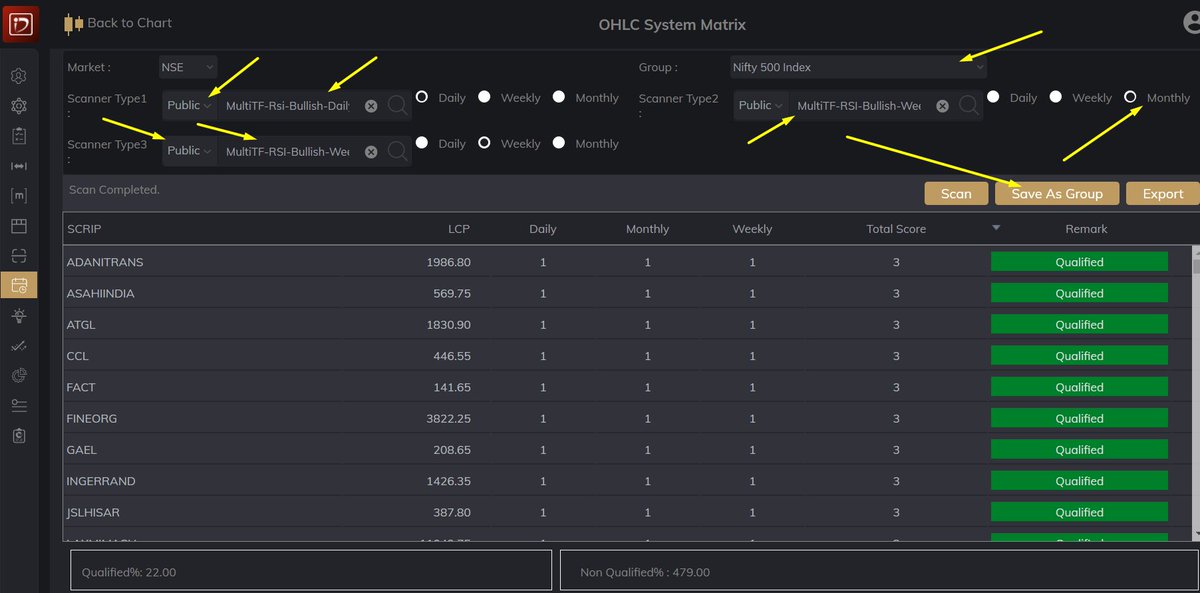
1. Quantitative Analysis in one place
2. Easy to find stocks where action taking place
3. Find the exact price levels at which OI is being added.
You can check out this free website by clicking on this link.
https://t.co/honvUA9lmx


https://t.co/Ngoc5bh906 Thank Mahek bhai for making this video basis my set up which i have been following since past 2 yr I\u2019m not promoting this software, neither I 'll gain any referral if anyone subscribes for this software ,Purpose is to share help fellow traders!\U0001f60a
— itrade(DJ) (@ITRADE191) September 5, 2021
5. A THREAD on . . . .
— Aditya Todmal (@AdityaTodmal) July 11, 2021
How @ITRADE191 selects strikes to trade in and how he follows risk management.
Short thread explained via pictures with the help of @niki_poojary.https://t.co/YiYYaIReNS
6. Thread on how @ITRADE191 made 3 lakhs in 2 days.
— Aditya Todmal (@AdityaTodmal) July 11, 2021
You will need:
1. Pivots
2. Vwap
3. PDL/PDH (Previous day high/low)
4. Advance/Decline Ratio.https://t.co/o9tLOaLpEh
7. DJ @ITRADE191 multiple chart analysis for INTRADAY TRADING.
— Aditya Todmal (@AdityaTodmal) July 11, 2021
1. Core setup
2. Pivot points trades
3. PDH/PDL trades
4. Open interest addictions combined with rejections on charts.
5. Website to confirm biashttps://t.co/qZQCWOSisa
Some important quotes by Jesse Livermore... pic.twitter.com/UklL86oTvb
— Mark Minervini (@markminervini) June 16, 2021
The big turning point in my trading came when I made a decision and vowed to NEVER EVER let a loss exceed 8%. During the next 5 years I averaged 220% per year for a total compounded return of 33,500%. It's been 28 years since and I have never broken that discipline not even once!
— Mark Minervini (@markminervini) April 26, 2021
A few key decisions early in my trading career and my financial life completely changed for the better in just a few years.
— Mark Minervini (@markminervini) June 13, 2021
1. No big losses
2. No averaging down
3. No chasing extended stocks
4. No giving back decent profits
5. Always get odds on my money
Only losers discourage dreamers. Only those who never achieved big things discourage those attempting to achieve big things. Only those who think small discourage those who think big. Never believe discourages. The have no credibility! Believe winners. Believe in YOU! \U0001f447 pic.twitter.com/JdAhRy3lRJ
— Mark Minervini (@markminervini) June 14, 2021
Do you want to know how to create a Trading Plan using only Price Action?
— Nikita Poojary (@niki_poojary) October 26, 2022
Here's a breakdown of 11 simple yet powerful steps to create one: \U0001f9f5
Collaborated with @AdityaTodmal
10 most Powerful Intraday Setups with Screeners: \U0001f9f5
— Nikita Poojary (@niki_poojary) November 8, 2022
Collaborated with @AdityaTodmal
A set up which has a minimum Risk/Reward (R/R) of 1:4
— Nikita Poojary (@niki_poojary) October 2, 2022
This set up can be used for intraday, option selling, option buying, as well as investing.
Maximum profit strategy by Subasish Pani.
Bollinger band set-up: \U0001f9f5!
Collaborated with @AdityaTodmal pic.twitter.com/aEIUVQF2XY
As a dean of a major academic institution, I could not have said this. But I will now. Requiring such statements in applications for appointments and promotions is an affront to academic freedom, and diminishes the true value of diversity, equity of inclusion by trivializing it. https://t.co/NfcI5VLODi
— Jeffrey Flier (@jflier) November 10, 2018