"Quote Retweet" ur mail ID
if u want free scanner for the strategy posted below.
I will send separate Scanners for
1. EOD analysis for preparing trade plan
2. Live Trading with entry signals
Bullish scanner for day/swing trading
— Aneesh Philomina Antony (ProdigalTrader) (@ProdigalTrader) March 3, 2022
Stocks which made new 52 week high in last 1 month, today closed at day high & abv previous day range.
Bearish scanner for day/ swing trading
Stocks made new 52 week low in last 1 month, today closed below previous day low & near day low.
More from Aneesh Philomina Antony (ProdigalTrader)
Few concepts upon which day trading systems can be built upon
https://t.co/3eAoEqM7QQ up trending market look for pin bar with good volume
2.Rsi divergence and macd histogram divergence both at the same time on 3 min chart
https://t.co/qrAH9PZ6D3 = Low (15min)
1/7
4.ORB with 15 min candle stick along with support and resistance of previous 5 days
5.Pullbacks in Strong momentum (wide range candles + Volume) stocks
6.ORB with volatility contraction and then wide range candle breakout with volume expansion
2/7
7.Fakeout like spring and Upthrust for entry pullback with low volume
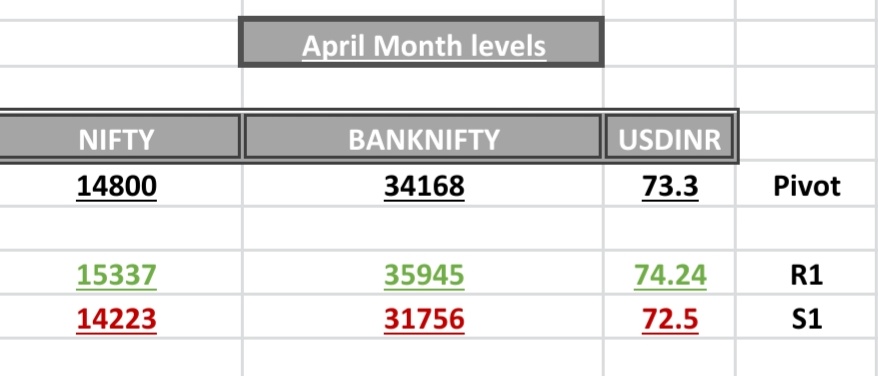
8.CPR analysis with standard pivots
9.PDH/PDL breakout with volume, vwap and RSI confirmation
3/7
10.Horizontal support/resistance from HTF and confirmation of acceptance or rejection in lower timeframe as reversal candlestick patterns with volume confirmation
https://t.co/75kykbExlg writing data and Put Writing data in correlation with price action
4/7
12.Pivots (Fibonacci) and Price action with volume activity
13.Ichimoku set ups with previous day NR4/NR7 scrips with pivots and volume as trading tools
https://t.co/JcwqOZS5L4 and rejections on 100/200 ema
15.EMA20 and rsi divergence with daily trend structure
5/7
https://t.co/3eAoEqM7QQ up trending market look for pin bar with good volume
2.Rsi divergence and macd histogram divergence both at the same time on 3 min chart
https://t.co/qrAH9PZ6D3 = Low (15min)
1/7
4.ORB with 15 min candle stick along with support and resistance of previous 5 days
5.Pullbacks in Strong momentum (wide range candles + Volume) stocks
6.ORB with volatility contraction and then wide range candle breakout with volume expansion
2/7
7.Fakeout like spring and Upthrust for entry pullback with low volume
8.CPR analysis with standard pivots
9.PDH/PDL breakout with volume, vwap and RSI confirmation
3/7
10.Horizontal support/resistance from HTF and confirmation of acceptance or rejection in lower timeframe as reversal candlestick patterns with volume confirmation
https://t.co/75kykbExlg writing data and Put Writing data in correlation with price action
4/7
12.Pivots (Fibonacci) and Price action with volume activity
13.Ichimoku set ups with previous day NR4/NR7 scrips with pivots and volume as trading tools
https://t.co/JcwqOZS5L4 and rejections on 100/200 ema
15.EMA20 and rsi divergence with daily trend structure
5/7
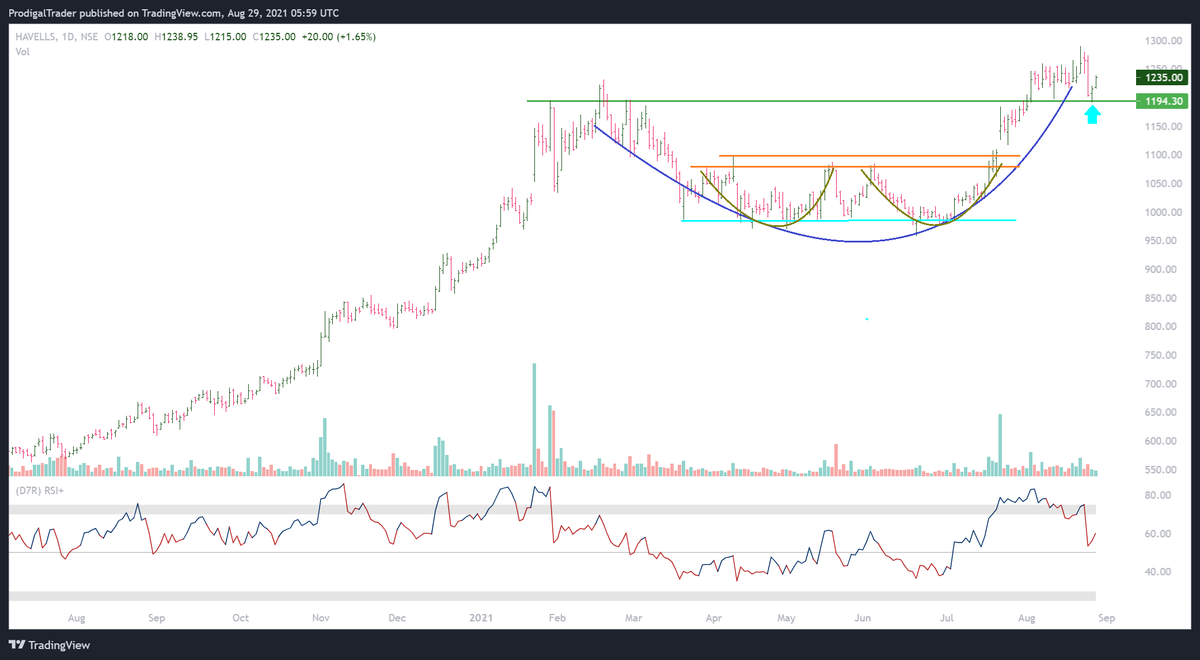
Parameters
1.Price structure - higher swing highs & swing lows
2. Momentum - doubled in last 250 days & trade close to recent highs
3. Demand - Higher volume on green bars
4. Volatility - Bigger bars on upside & shorter on downside
5. Relative strength - Outperforming market
1.Price structure - higher swing highs & swing lows
2. Momentum - doubled in last 250 days & trade close to recent highs
3. Demand - Higher volume on green bars
4. Volatility - Bigger bars on upside & shorter on downside
5. Relative strength - Outperforming market
Hello Aneesh, (1) apart from the volume supported HH-HL formation in ATH or 52 weeks high stocks, what other data point u see to shortlist scrip? (2) How do u estimate the holding period for the scrip? Plz guide
— Rohit Khanna\U0001f1ee\U0001f1f3 (@Rohit_MktWale) March 26, 2022
More from Screeners


On the occasion of youtube 20k and Twitter 70k members
A small tribute/gift to members
Screeners
technical screeners - intraday and positional both
before proceeding - i have helped you , can i ask you so that it can help someone else too
thank you
positional one
run - find #stock - draw chart - find levels
1- Stocks closing daily 2% up from 5 days
https://t.co/gTZrYY3Nht
2- Weekly breakout
https://t.co/1f4ahEolYB
3- Breakouts in short term
https://t.co/BI4h0CdgO2
4- Bullish from last 5
intraday screeners
5- 15 minute Stock Breakouts
https://t.co/9eAo82iuNv
6- Intraday Buying seen in the past 15 minutes
https://t.co/XqAJKhLB5G
7- Stocks trading near day's high on 5 min chart with volume BO intraday
https://t.co/flHmm6QXmo
Thank you