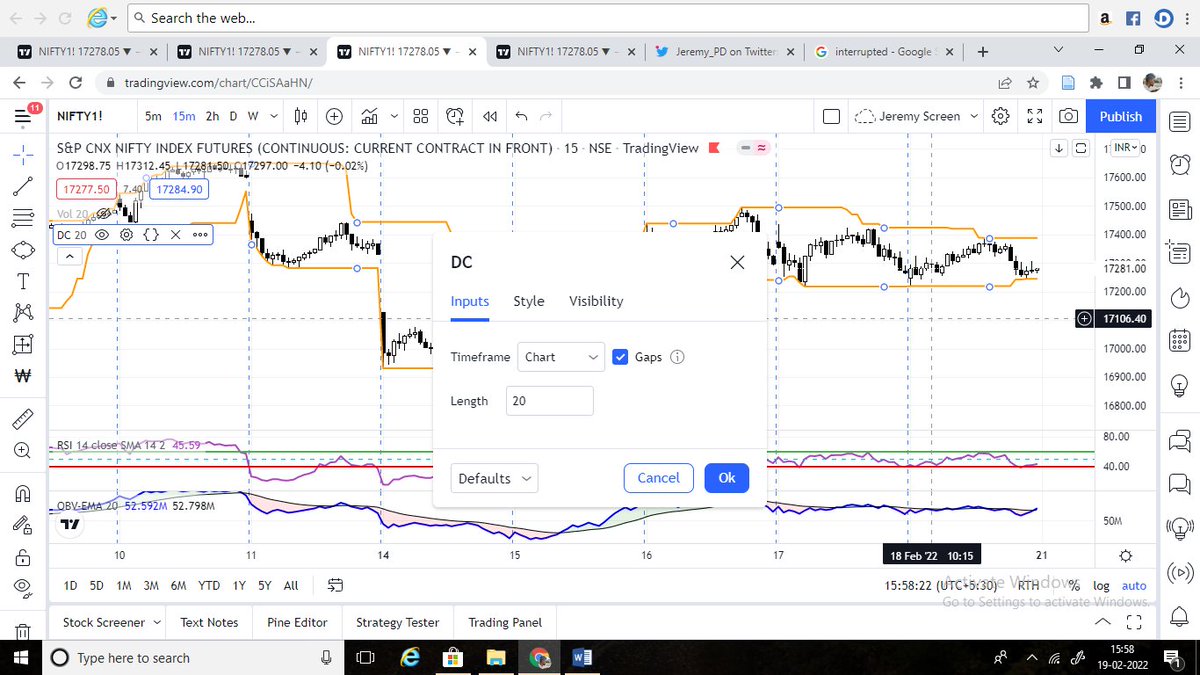
This is how the setup looks like. THREE indicators are to be used.
1. DONCHIAN CHANNEL (length 20)
2.RSI (length 14, upper band 60 , lower band 4)
3. OBV-EMA (input 20 )
All the indicators are available in trading view.
(1/n)
settings for the indicators
(2/n)
PURPOSE of each indicator
DC - will serve as a tool for ENTRY
RSI - will serve as a tool for entry confirmation as well as ENTRY
OBV-EMA - will serve as a tool for TREND IDENTIFICATION as well as TRADE EXIT
(3/n)
There will be TWO TYPES of ENTRY
1. ENTRY A = entry with the help of DC (please remember this )
2. ENTRY B = entry with the help of RSI (please remember this )
(4/n)
Rules for ENTRY A
For LONG entry
DC BREAKOUT
RSI > 60
OBV in BUY MODE
(5/n)
For SHORT entry
DC BREAKDOWN
RSI < 40
OBV in SELL MODE
(6/N)
The PURPOSE of ENTRY A
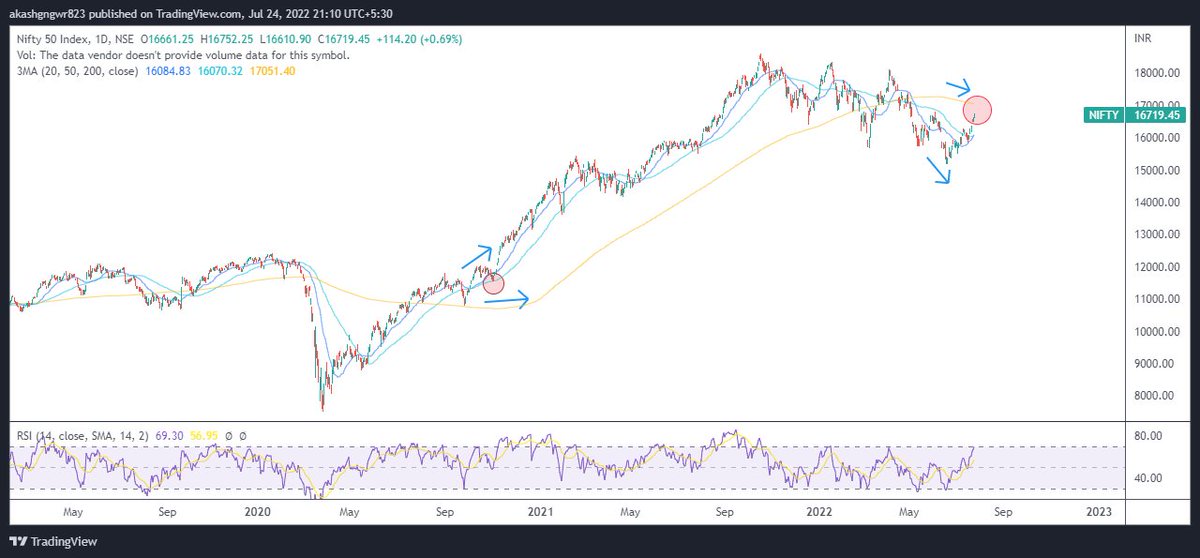
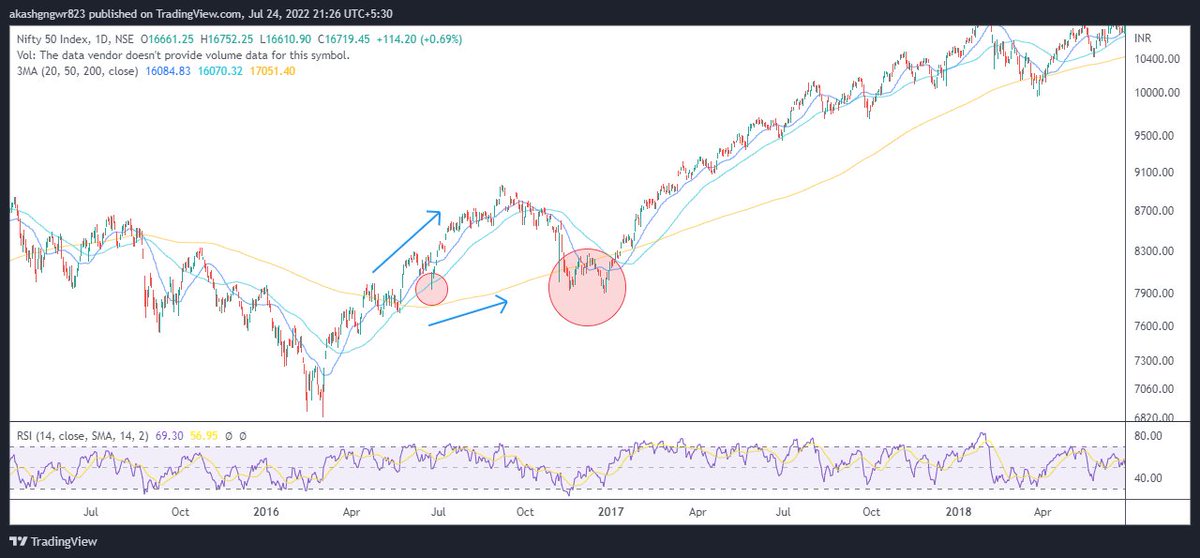
ENTRY A will help you to catch an ONGOING TREND.
In other words you will be able to enter on the MAJOR TREND that has been going on for the past few days.
(7/n)
RULES FOR ENTRY B (entry with RSI )
For SHORT entry
RSI BREAKDOWN below 40
OBV in SELL MODE
DONT WAIT FOR DC BREAK ( DC has no role in this entry)
(8/n)
For LONG entry
RSI BREAKOUT above 60
OBV in Buy Mode
DONT WAIT FOR DC BREAK (DC has no role in this entry )
(9/n)
PURPOSE OF ENTRY B
Entry B will help you catch INTRADAY REVERSALS
Hence you are participating both on the major trend with entry A as well as on the minor trend with entry B
(10/n)
examples of some entries
includes both entry A and entry B
valid entries are written in GREEN
invalid entries are written in RED
(11/n)
Now SL PLACEMENT
1. FOR NIFTY
a. CANDLE LOW if less than 60 points
b. If Candle LOW is more than 60 points then don't put SL at CANDLE LOW.
We will not give market more than 60 points on any trade.
if you are conservative like me then stick to 40 points.
(12/n)
2. FOR BANK NIFTY
a. CANDLE LOW if less than 150 points
b. If CANDLE is more than 150 points then dont put at candle low
We will not give market more than 150 points on any trade
if you are conservative like me then stick to 120 points
(13/n)
TRADE MANAGEMENT (V. important)
1. Trail your SL by 1 point for every 2 point move
eg. if price moves 20 points trail your SL by 10 points
2. Once Price moves 1.5 times of your Risk. Move SL to COST.
eg. if risk is 40 points. When price moves 60 points shift SL to COST.
14/n
EXIT
1. DO NOT BOOK 1:2. It will REDUCE your profitability
We are TREND FOLLOWERS. Our SL will be fixed.
NOT OUR PROFIT.
2. When you have moved SL to cost you will do NOTHING.
JUST SIT TIGHT
3. EXIT at END OF DAY or if OBV changes its COLOUR
(15/n)
if you can FOLLOW (15/n) RELIGIOUSLY your losses will be very small but your profits will be huge
look at the pictures. OBV did not change colour the whole day. if you can capture these days several days of your small losses will be covered in one single day.
(16/n)
1. TIME FRAME : 15 min ONLY. Even working people can trade easily as you don't have to look at screen continuously
2. AFTER SL is at COST: NO MORE INTERFERENCE from your side. YOU HAVE TO BE DISCIPLINED. let the trade RUN.
(17/n)
3. If 2 SL hit then STOP.
4. In Trend Following Less is more. Lesser the interference, better the result.
(18/n)
Finally, I cant make money for you. Following the TRADE MANAGEMENT and EXIT rules RELIGIOUSLY will MAKE or BREAK the System.
Backtest, build conviction then use. If you EXECUTE it to the CORE, money will come I promise.
Happy Trading.
The End. :)
I will share the backtest result of FEBRUARY tomorrow so you get a reference point to start with ( take time to backtest for 1000+ trades) and from Monday will do live forward test till the end of this month. 🙏🏼