So the concept of relative strength will tell you in advance before a breakout about the accumulation by smart hands. The RS will go up before the breakout and the stock will be near to the highs. Near to the highs is only what I am interested in. No bottom fishing.
Some went into the watchlist and some were actionable where my few long positions are already open.
— The_Chartist \U0001f4c8 (@charts_zone) December 25, 2021
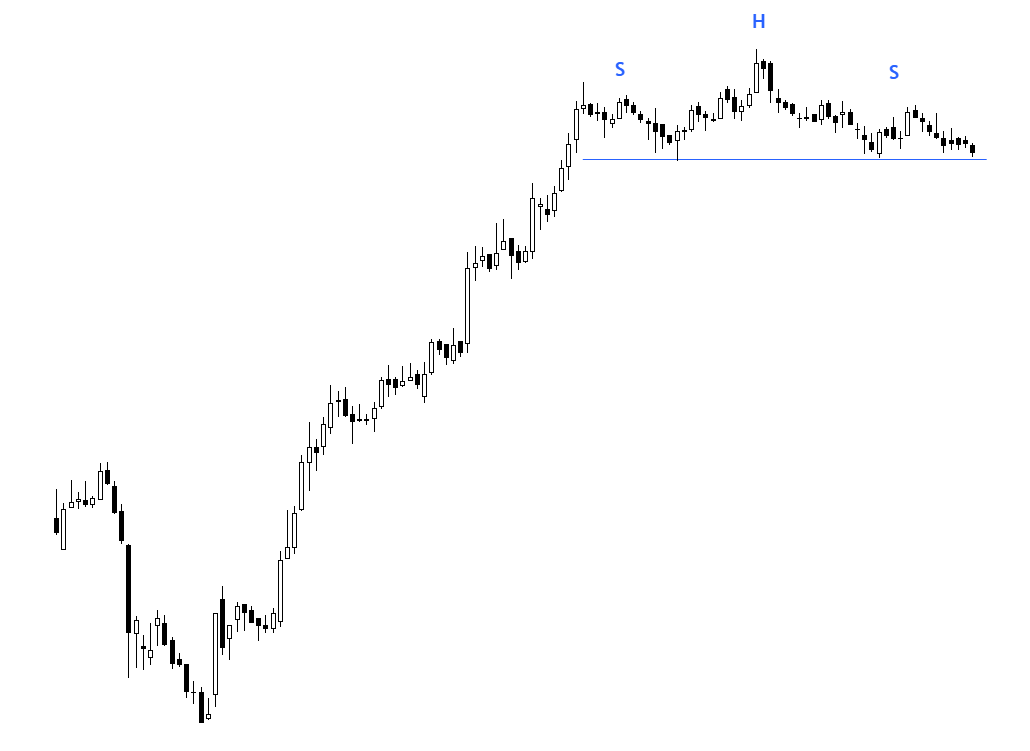
What am I looking at in the charts? Flat base formation breakouts/Pullbacks/Trendline support. Keep it simple. Ex attached.
29/95 for further funda scans. P<100 (I don't trade) https://t.co/y4PKUBrA44 pic.twitter.com/e9cvcrKsnu
More from The_Chartist 📈
I have mentioned before too good material on RS
1. A Book written by Sir @Prashantshah267 as attached
2. Research paper by @MebFaber April 2010
3. A book written by Sir Robert A. Levy as attached
4. Webinar by Sir @premalparekh with @vivbajaj
5. Video by @jfahmy on YT https://t.co/xg4fe09ImL
1. A Book written by Sir @Prashantshah267 as attached
2. Research paper by @MebFaber April 2010
3. A book written by Sir Robert A. Levy as attached
4. Webinar by Sir @premalparekh with @vivbajaj
5. Video by @jfahmy on YT https://t.co/xg4fe09ImL
Hi sir ..can u post some articles or write up on relative strength ,how to use same and what is the criteria .. kindly help
— Nanda (@vk_nandagopal) December 11, 2021

You are seriously missing a lot of information if you are not maintaining a trading journal. It is much better if you also take a snap of the charts you trade for the post-analysis.
This exercise will tell you about your inherent strengths & weaknesses. 👇👇
This exercise will tell you about your inherent strengths & weaknesses. 👇👇
How to record a trading journal (TJ) & what to analyze?
— The_Chartist \U0001f4c8 (@charts_zone) December 14, 2021
What is in a TJ?
Buy Date
Stock Name
The time frame you analyzed (D/W/M)
Long/Short?
Buy Price
SL
Sell Price
Risk took (% of capital)
Sell date
No. of days held
P/L
P/L as % of capital
Buy Reason?
Invested capital/trade pic.twitter.com/WnrvmYuOV0