Central Pivot Range (CPR) acts like a magnetic level for any stock/index. Traders use it for intraday but it works on higher time frame as well.
CPR is just the three lines which is like a magnet and price approaches these levels. CPR acts like a support or resistance.
2/24
What are these three lines now?
𝗣𝗶𝘃𝗼𝘁 = (High + Low + Close)/3
𝗕𝗖 = (High + Low)/2
𝗧𝗖 = (Pivot – BC) + Pivot
For intraday chart use previous day candle HLC. Similarly, for Daily Chart it would be Monthly HLC. For Weekly/Monthly Chart use Yearly HLC.
3/24
This indicator is available on Zerodha Kite (web version) and it works well there. It's also available in
@tradingview but setup needs to be done based on the time frame.
Images are shared for CPR setup of both the terminals (Zerodha and Tradingview).
4/24
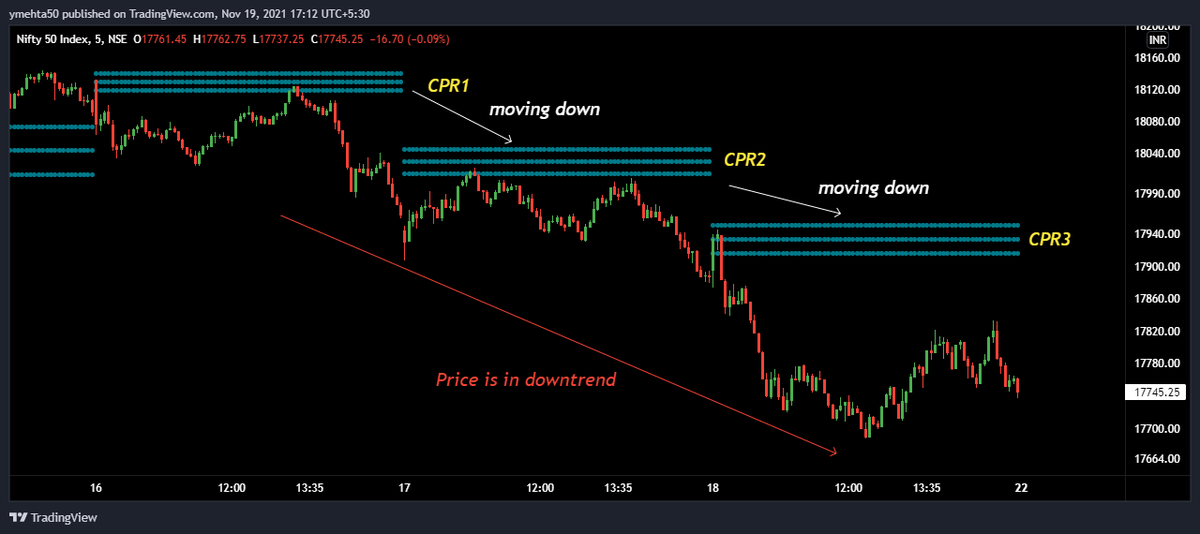
CPR can be used in finding trend.
If CPR is moving up for the next day, then trend is up. If CPR is moving down for the next day, then trend is down.
Some examples for both:
In the below chart of Nifty (5 mins), CPR is moving down and price is also in downtrend.
5/24
Again Nifty chart (5 mins)
CPR was moving up on subsequent days. Price was also in uptrend during that time.
One can use higher time frame charts as well to find out long term or short-term trend.
6/24
Let's see monthly chart of Asian Paints to see how long term uptrend can be seen using CPR.
CPR is moving up every year and price is also in an uptrend for last 14 years.
Price moved up from 80 to 3200 (4000% returns).
Similar CPR can be used on any other time frame.
7/24
CPR can also be used in finding future #trend in stocks or index.
If CPR is narrow, then it is expected that there would be a good one sided trend. If CPR is broad, then it is expected that there would be a consolidation or sideway move.
8/24
Let's see both the examples now.
Wide CPR was formed and price was in consolidation for intraday. This was a good day to eat premium in options because of theta decay.
When narrow CPR was formed then one sided move was seen.
9/24
How much narrow or broad is quite subjective. One can use their own judgement in that case. Also, it's not necessary that price will follow this rule always. This was just an observation.
10/24
#Intraday #Buy Trading Setup:
1. Use 5 mins time frame.
2. Add CPR indicator.
3. If price is above CPR then wait for the retest. If price retest CPR and forms bullish candle (hammer, engulfing) then go long.
4. Stoploss will be candle's low or just below the lowest CPR.
11/24
5. Use Trailing Stoploss using your own method (I use price action)
6. Try to target atleast 1:2 Risk Reward or even more than that.
12/24
Let's see some case study/examples.
Nifty [5mins].
Price retest CPR region and gave confirmation with a bullish candle.
Then price moved up from 17740 to 17950. Almost 200 points move.
Price had retested CPR multiple times. Just keep stoploss below the lowest CPR.
13/24
#Intraday #Buy Trading Setup:
1. Use 5 mins time frame.
2. Add CPR indicator.
3. If price is below CPR then wait for the retest. If price retest CPR and forms bearish candle (shooting star, engulfing) then go short.
4. SL will be candle high or just above the highest CPR.
14/24
5. Use Trailing Stoploss using your own method (I use price action)
6. Try to target atleast 1:2 Risk Reward or even more than that.
15/24
Let's see some case study/examples.
Nifty [5mins].
Price retest CPR region and gave confirmation with a bearish candle.
Then price moved up from 18112 to 17960. Almost 150 points down move.
Price had retested CPR. Just keep stoploss below the lowest CPR.
16/24
This was quite an interesting setup for intraday #traders. This is not a holy grail strategy. Just check the chart and see how it works on other stock or index.
I personally use CPR only on #Nifty and #BankNifty for intraday.
17/24
Now let's see how CPR can be use for Swing or Positional Trading.
Rules will remain same as that of intraday that we have discussed.
Time frame would be Daily or Weekly. So use Monthly CPR in case of Daily chart and Yearly CPR for Weekly chart.
18/24
I focus on buying strategy. But one can use it on sell side as well if you are trading in derivatives where overnight short is possible.
Let's see an example for Swing Buy Setup.
Reliance Daily Chart.
When price retested CPR after that it rallied by 10%.
19/24
One can use an hourly chart as well to find out short-term trades.
Rules will remain same here and no change.
Best part of CPR is one can use any time frame and appropriate CPR calculation time frame to find out decent trades from intraday to investment.
20/24
Now let's see #Investment Strategy/Positional Trading Strategy.
1. Use Weekly/Monthly time frame chart.
2. Use CPR based on last Year HLC value.
3. Other all rules will remain same as discussed in intraday setup.
4. Stoploss rule and Risk: Reward rule also remain same.
21/24
Let's see an example for Investment setup.
JK Cement (monthly chart).
Price retested CPR and then gave confirmation with hammer candle.
Price moved from 146 to 360. Profit of 146%.
Check all the chart of stocks during Covid Crash for an interesting observation.
22/24
Strategy based on CPR is easy only if one follows all the rule.
Key point is to sit with the patience for the returns.
As quoted by Livermore: "Sit tight when you are Right."
In case if you have any queries or doubts then do mention it in comments.
23/24
I hope everyone understood how CPR can be used.
These are not a universal rules one must follow. One can create their rule or follow someone else rules.
Only important thing is one must follow a fix rule instead of tweaking or changing setup frequently.
24/24