Many of you ask me why I choose 75 or 125 minutes charts
I do this only for equity charts in NSE or BSE as they trade from 9.15 a.m. to 3.30 p.m. , i.e. 375 minutes
75 minutes devide the day in 5 & 125 min in 3 equal candles
While hourly / 2 hourly charts have unequal candles
More from Techno Prince


More from Screeners



How was the trap set in USA Small-Cap index
Russell 2000
It is better if you spend considerable time learning these concepts. https://t.co/caBHOO4Owa
Russell 2000
It is better if you spend considerable time learning these concepts. https://t.co/caBHOO4Owa
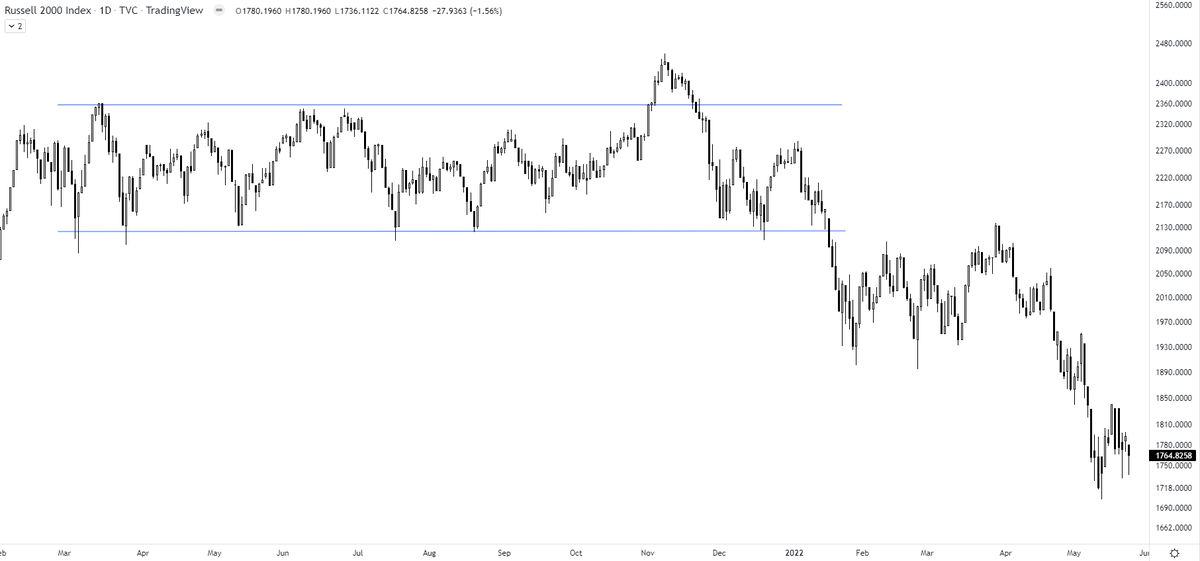
TRAPS? In a false breakout, the price breaks out of the range & comes back within the range. A trap is one step ahead, price not only comes back within the range but breaks down in the opposite direction. It traps the initial longs who didn't close their positions
— The_Chartist \U0001f4c8 (@charts_zone) January 22, 2022
Russell 2000 pic.twitter.com/txzjdnStzc