On the occasion of youtube 20k and Twitter 70k members

A small tribute/gift to members

Screeners

technical screeners - intraday and positional both

before proceeding - i have helped you , can i ask you so that it can help someone else too

thank you

positional one

run - find #stock - draw chart - find levels

1- Stocks closing daily 2% up from 5 days
https://t.co/gTZrYY3Nht

2- Weekly breakout
https://t.co/1f4ahEolYB

3- Breakouts in short term
https://t.co/BI4h0CdgO2

4- Bullish from last 5 days
https://t.co/80ha9H2S2d
intraday screeners

5- 15 minute Stock Breakouts
https://t.co/9eAo82iuNv

6- Intraday Buying seen in the past 15 minutes
https://t.co/XqAJKhLB5G

7- Stocks trading near day's high on 5 min chart with volume BO intraday
https://t.co/flHmm6QXmo

Thank you

More from Vibhor Varshney

More from Screeners

TradingView isn't just charts

It's much more powerful than you think

9 things TradingView can do, you'll wish you knew yesterday: 🧵

Collaborated with @niki_poojary

1/ Free Multi Timeframe Analysis

Step 1. Download Vivaldi Browser

Step 2. Login to trading view

Step 3. Open bank nifty chart in 4 separate windows

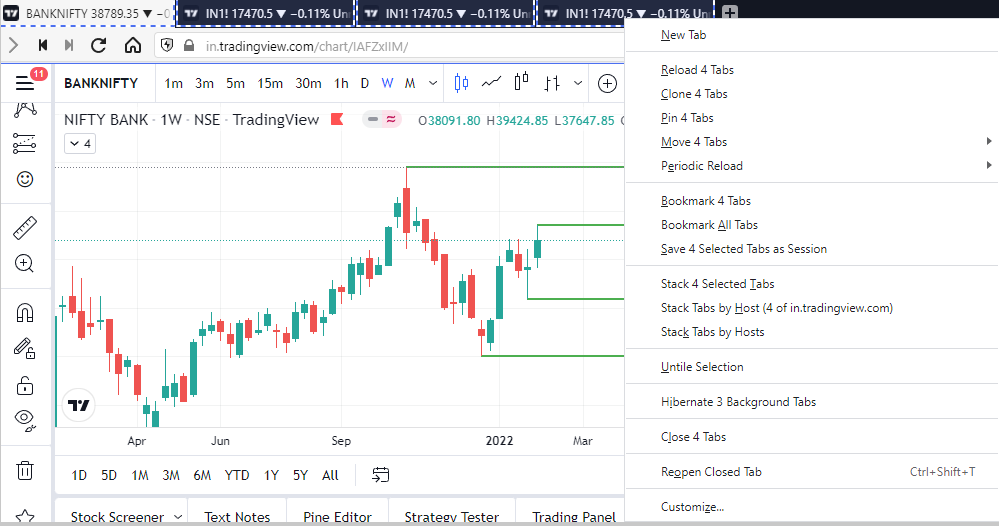
Step 4. Click on the first tab and shift + click by mouse on the last tab.

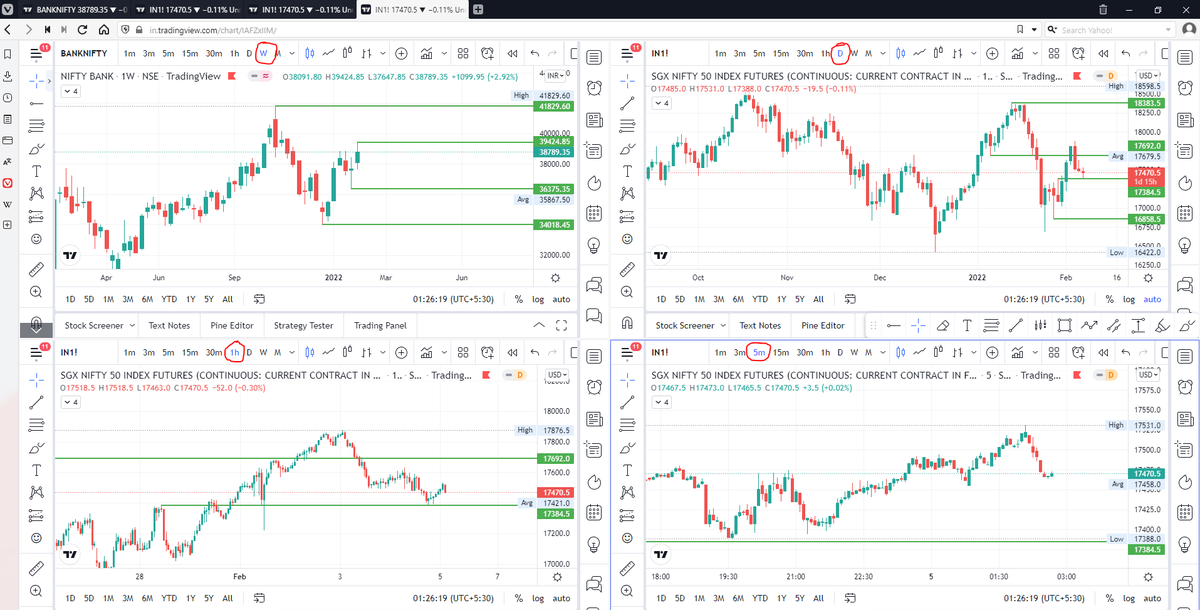
Step 5. Select "Tile all 4 tabs"


What happens is you get 4 charts joint on one screen.

Refer to the attached picture.

The best part about this is this is absolutely free to do.

Also, do note:

I do not have the paid version of trading view.


2/ Free Multiple Watchlists

Go through this informative thread where @sarosijghosh teaches you how to create multiple free watchlists in the free


3/ Free Segregation into different headers/sectors

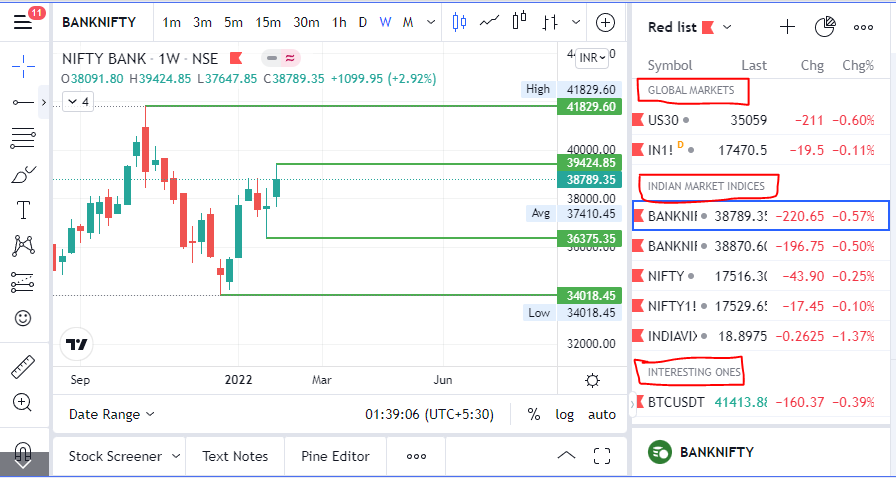
You can create multiple sections sector-wise for free.

1. Long tap on any index/stock and click on "Add section above."
2. Secgregate the stocks/indices based on where they belong.

Kinda like how I did in the picture below.
Time for a new thread on the possibilities I am looking for.
Do read it completely to understand the stance and the plan.


1. The moving average structure - Many traders just look at the 200 ma test or closing above/below it regardless of its slope. Let's look at all the interactions with 200 ma where price met it for the first time after the trend change but with 200 ma slope against it


One can clearly sense that currently it is one of those scenarios only. I understand that I might get trolled for this, but an unbiased mind suggests that odds are highly against the bulls for making fresh investments.

But markets are good at giving surprises. What should be our stance if price kept on rising? Let's understand that through charts. The concept is still the same. Divergent 200 ma and price move results in 200 ma test atleast once which gives good investment opportunities.


2. Zig-Zag bear market- There are two types of fall in a bear market, the first one is vertical fall which usually ends with ending diagonals (falling wedges) and the second one is zig zag one which usually ends with parabolic down moves.

You May Also Like